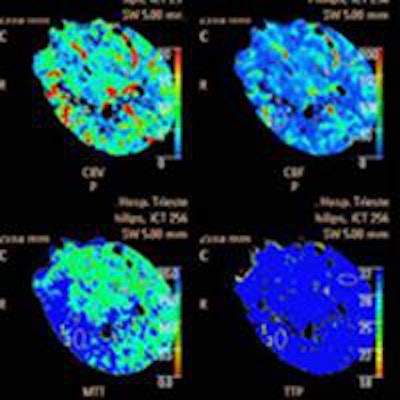
VIENNA - Automatically generated color CT perfusion maps have a role in the emergency care of ischemic stroke patients, but they are less accurate than manually generated maps, according to research presented at ECR 2015.
In the study, 26 patients with ischemic stroke underwent perfusion imaging in addition to noncontrast CT. Perfusion and core maps were automatically generated, along with separate evaluation of cerebral blood flow (CBF), cerebral blood volume (CBV), and mean transit time (MTT). The results showed that the manually generated maps were at least 10% more accurate than automatically derived maps, the researchers from Trieste, Italy, found.
"Analysis of the manually generated maps had greater sensitivity in comparison with the maps generated by the software, in particular in the infratentorial area and in the basal ganglia area [where] it tends to underestimate the extent of perfusion" said Dr. Maja Ukmar from the department of radiology at the University of Trieste.
The role of perfusion CT has yet to be clarified in the workup of ischemic stroke patients, but ongoing data show an important place for the technique, particularly in patients with symptom onset beyond four or five hours and in those who benefit from recanalization, according to Ukmar.
"We think there will be extensive use of perfusion CT in emergency settings in the coming years, even by less-experienced users," she said.
Is the software good enough?
The study aimed to compare the accuracy of manually generated perfusion maps (CBF, CBV, MTT) with maps generated automatically by commercially available software (Brain Perfusion, Philips Healthcare) for the definition of infarct core and penumbra in acute ischemic stroke patients less than five hours after symptom onset.
All imaging was performed with a 256-detector-row scanner (Brilliance iCT, Philips), beginning with noncontrast CT at admission and then perfusion CT after injection of 75 mL of contrast media (followed by 40 mL of saline at 4 mL/sec). Perfusion images were acquired every four seconds for a total scan duration of 60 seconds at 80 kV and 150 mAs to 200 mAs.
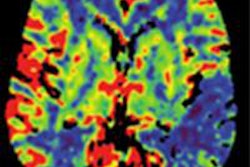
Manual image processing was used to generate perfusion maps, followed by the software maps, "in which the green area meets the criteria for penumbra, and the red area meets the criteria for the infarct core," Ukmar said.
After excluding patients without follow-up, the group analyzed the results of 19 patients.
Comparative performance
Among the manually generated maps, five had no perfusion abnormalities (two true negatives, three false negatives), while 14 showed perfusion abnormalities. There were 29 areas of perfusion deficit, including 15 compatible with ischemic penumbra and 14 with infarcted tissue, with a total of 14 true-positive cases on the manually generated maps.
For the manually generated maps, sensitivity was 82.3%, positive predictive value was 100%, specificity was 100%, and negative predictive value was 40%.
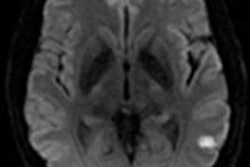
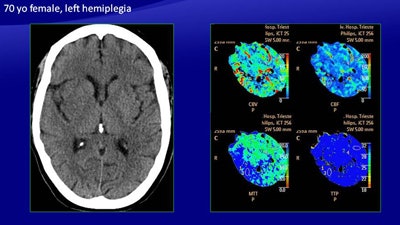 In a 70-year-old woman with left hemiplegia, CT (above) shows a slight hypodensity in the right basal ganglia, a large area of increased MTT, and a smaller area of reduced CBV and CBF. The automatically generated color map depict a large area of ischemic penumbra and a smaller area of infarcted core, which was confirmed on follow-up CT (below). All images courtesy of Dr. Maja Ukmar.
As for the automatically generated maps, among the 19 patients with follow-up CT, seven had no perfusion abnormalities (two true negatives, five false negatives), while 12 patients had perfusion abnormalities. There were 25 areas of perfusion deficit: 15 were compatible with ischemic penumbra and 10 were compatible with infarcted tissue, with a total of 12 true-positive cases.
For the automatically generated maps, sensitivity was 70%, positive predictive value was 100%, specificity was 100%, and negative predictive value was 28%.
Among the ischemic penumbra results, one true positive on CBV analysis was a false negative on the automatically generated map, representing a large ischemic penumbra of the parietal lobe, adjacent to a large stroke.
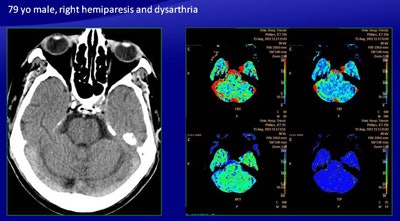 There were discordant results with automatically generated perfusion maps in the case of a 79-year-old man presenting with right hemiparesis and dysarthria (above). Manual mapping showed an area of reduced CBV, reduced CBF, and increased MTT in the left pons, suggesting infarction of the pons, but the color map showed only abnormalities, leading to a false negative as confirmed on follow-up CT (below).
For infarcted tissue, in four of 14 cases there was a discordance -- all true positive on the manually generated maps and all false positive on the software generated maps. These included three false positives in the basal ganglia. There was also one false negative produced by the software.
"There was an area of reduced CBV, reduced CBF, and increased MTT in the left pons, suggesting an infarction of the pons, but the color map showed only abnormalities, leading to a false negative revealed in the follow-up CT, which showed a large infarct in the pons," Ukmar said.
Automatic only for emergencies
The automatically generated maps had lower sensitivity than the manually generated ones, particularly in the infratentorial area and the basal ganglia area. The automated scheme also tends to underestimate the extent of perfusion of the ischemic penumbra.
"The addition of maps generated automatically by software could help in the emergency setting, in particular for less-expert operators," she said. "However, if you want a more accurate evaluation for surgical purposes, we can note that evaluation of the different parameter maps is mandatory."
