Machine-learning techniques analyze imaging measurements to automatically stratify patients by the level of atherosclerotic burden, offering the potential of personalized prediction of disease progression and more effective treatment for individual patients, according to researchers from Italy.
In an exploratory project, researchers from Fondazione G. Monasterio, CNR-Regione Toscana in Pisa, employed an analysis they called radiophenomics, which essentially consolidates a patient's radiological measurements into Cartesian coordinates on a graph in order to reveal a patient's phenotype. Their machine-learning method was able to classify patients into three phenotypes that represent different levels of atherosclerotic burden.
"Radiological phenotyping of atherosclerosis is computationally feasible and pathophysiologically interpretable," said senior author Dr. Dante Chiappino. He presented the research on behalf of lead authors Andrea Ripoli and Daniele Della Latta during a scientific session at RSNA 2017 in Chicago.
A complex disease
A complex and progressive disease, atherosclerosis affects a very large part of the world population, and its appearance and progression is entangled in a complex network of genetic, environmental, socioeconomic, and behavioral determinants, Chiappino said. Radiological imaging is one of the most effective tools for studying the progression of atherosclerosis.
A patient's phenotype is the set of observable characteristics of an individual that result from the interaction of its genotype with the environment, he said.
"The phenotype is in the radiologist's eyes, and the phenotype is the road to personalized medicine," he said. "The phenotype is the compass pointing to the North of molecular determinants of disease."
The phenotype is also very complex, especially for complex diseases, Chiappino said. As a result, the researchers sought to determine if it was possible -- using radiological information alone -- to automatically identify complex phenotypes that are significantly linked to atherosclerosis progression.
"Eventually, we wanted to see how such radiological phenotypes are related to [and] interpretable in the light of the statistical distribution of the interwoven risk factors," he said.
To accomplish their goal, the researchers used data from 1,826 asymptomatic subjects in the ongoing Montignoso Heart Lung Project (MHELP) screening study in Italy. This patient group, which was 54% female and 46% male, ranged in age from 45 to 75. All participants received low-dose chest CT scans for evaluation of pulmonary nodules as well as calcium scoring. The dataset also includes patient demographical information, cardiac and carotid ultrasound exams, and blood tests. In this screening study, subjects with negative initial CT screening exams were recalled every two years, while those with positive exams were recalled depending on the pathology or the associated cardiovascular risk.
Machine learning
In a sample of 1,283 patients, the researchers used machine-learning techniques to analyze nine patient radiology markers -- aortic valve volumetric calcium, mitral valve volumetric calcium, coronary volumetric calcium, Agatston coronary artery calcium score, pulmonary trunk diameter, pulmonary artery diameter, right carotid intima thickness, left carotid intima thickness , and the number of carotid plaques -- that were extracted directly from the images. The analysis also considered nine demographic and metabolic covariates, including patient age, male gender, body mass index (BMI), LDL cholesterol, HDL cholesterol, total cholesterol, triglycerides, hypertension, and diabetes.
An unsupervised random-forest algorithm then computed dissimilarities between patients for the nine radiological measurements and transformed these dissimilarities into 2D Cartesian coordinates. Next, the researchers applied a multidimensional scaling procedure to map each subject on a plane. A fuzzy c-means algorithm was then used to identify clusters of subjects in a similarity map.
These clusters in the data reflect phenotypes in the cohort of patients, Chiappino said. He noted that phenotypes are intrinsically "fuzzy" as a patient may partially belong to several phenotypes. However, the analysis revealed three distinct patient phenotypes that reflect different stages of atherosclerosis progression.
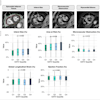
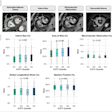
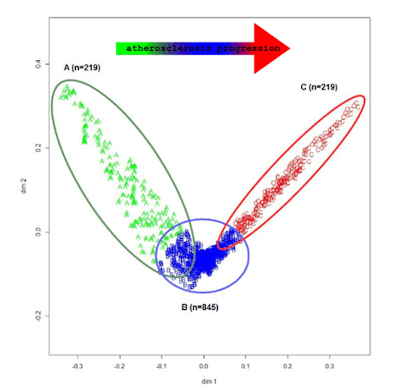 Machine-learning analysis and mapping of imaging measurements in asymptomatic screening subjects found data clusters that reflect three phenotypes for different stages of atherosclerosis progression. All images courtesy of Dr. Dante Chiappino.
Of the nine radiology markers, the amount of coronary volumetric calcium, the Agatston calcium score, and the number of carotid plaques were found to correlate the best with the phenotype cluster that had the highest level of atherosclerosis progression.
"This observation gave us confidence in treating the identified cluster as a progressive phenotype of atherosclerotic disease," Chiappino said.
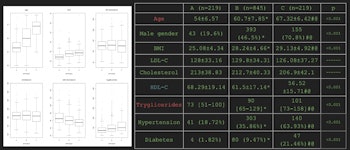
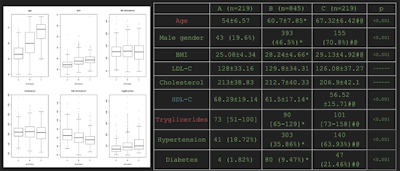
Mean demographic and metabolic covariate data for the three identified radiological phenotypes of atherosclerosis.
The patient Agatson scores, pulmonary diameters, intima thickness, and the number of carotid plaques all significantly increased from phenotypes A to B and B to C, according to the researchers. In addition, HDL cholesterol significantly decreased, while the age, percentage of male gender, and triglyceride levels increased. Phenotypes B and C also had a significantly higher BMI value than phenotype A.
The results show the feasibility of the radiophenomics method for atherosclerosis phenotyping, according to the authors
"What's essential is invisible to the eyes: the metabolic engine of atherosclerosis progression," Chiappino said. "Advances in both imaging technology and machine-learning methods promise fresh new science and translational applications."
