What's the best way to distinguish acute from chronic myocardial infarction on cardiac MRI (CMR) scans? German researchers found that native T1 and T2 mapping significantly outperform conventional measurements of the T2 ratio, and they presented their results at ECR 2017.
In a study that aimed to analyze the clinical value of novel cardiac MRI mapping techniques, the researchers examined 67 patients who underwent reperfusion for the first time following acute myocardial infarction. They found that both T1 and T2 maps easily outperformed T2-weighted ratio and the extracellular volume fraction for distinguishing the two types of myocardial infarction.
"Native T1 and T2 mapping are the best discriminators between acute and chronic myocardial infarction, outperforming standard T2-weighted CMR," said Dr. Emvar Tahir from the University Medical Center Hamburg-Eppendorf. Philips Research in Hamburg also participated in the study.
A better way to discriminate
In recent years, novel cardiac MRI mapping techniques have emerged that can directly measure T1 and T2 relaxation times, which correlate directly with the presence of myocardial edema, Tahir said. These may outperform conventional measurements of myocardial infarction and help triage patients more effectively.
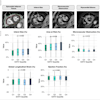
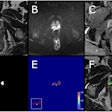
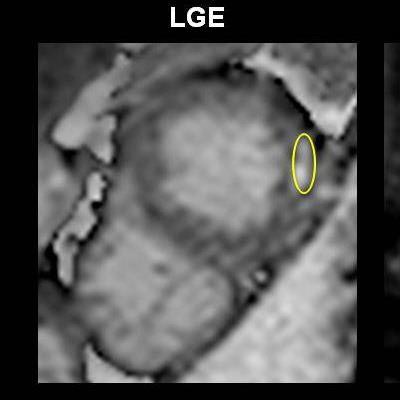
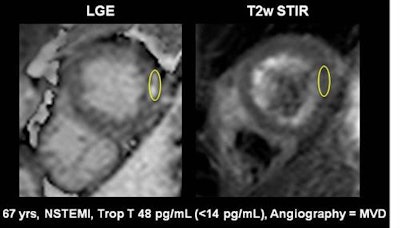 A 67-year-old male patient presenting with non-ST-elevated myocardial infarction (NSTEMI) and moderately elevated troponins, had multivessel disease on invasive angiography. Top image: Late gadolinium enhancement is visible at the lateral wall of the apex in CMR. To distinguish acute from chronic myocardial infarction (MI), the standard approach is to acquire a signal intensity (SI) value from the myocardium, build a ratio with the SI value from a skeletal muscle region of interest, and determine from the previously established cutoff whether the MI is acute or chronic. In this case, the SI was 3.4 (image below), which is above previously established cutoff meaning acute infarction per the standard method. However, CMR TI mapping (below) shows a value of 1020, well under the cutoff of 1037, revealing a chronic infarction requiring no intervention. All images courtesy of Dr. Emver Tahir.
Patients with acute and chronic myocardial infarction require different workup and treatment approaches. Treatment isn't generally indicated in chronic myocardial infarction cases, so differentiating the two accurately is important.
"The purpose of this study was to analyze the clinical utility of novel mapping techniques in comparison with standard T2-weighted MR imaging to discriminate acute from chronic MRI," Tahir said.
The study enrolled 67 patients (51 men and 16 women) with first-time acute myocardial infarction. Baseline cardiac MR images were obtained at 8 ± 5 days after infarction as well as 6 ± 1.4 months thereafter on a 1.5-tesla scanner (Achieva, Philips Healthcare).
The investigators performed all imaging on end-diastolic left-ventricular short-axes. They quantified T2 relaxation times using a free-breathing, navigator-gated multiecho sequence. T1 relaxation times were measured using the modified Look-Locker inversion recovery sequence for native and postcontrast imaging and native T1 mapping. They generated parametric maps using a plug-in for OsiriX software (Pixmeo). ECG triggering and breath-hold are routine in the institution, as is the use of a five-channel cardiac coil, he said.
The team acquired three representative cardiac end-diastolic short-axis slices of the left ventricle. The T2 imaging was performed with hybrid sequences -- a combination of gradient and spin-echo sequences, and late gadolinium enhancement was performed with inversion-recovery sequences including late gadolinium and inversion recovery, Tahir said.
Regions of interest (ROIs) in the remote and infracted myocardium were reviewed by two observers for the native images as well as for the T2 maps, he said. T2-weighted-ratio was also generated, based on mean SIinfarct/mean SIremote.
Superiority of Native T1/T2
Absolute values of native T1 and T2 relaxation times in acute and chronic myocardial infarction show excellent results with native T1 and T2 mapping.
| Values of cardiac MRI protocols for myocardial infarction | ||
| Parameter | Acute myocardial infarction | Chronic myocardial infarction |
| Native T1 | 1,286 ± 99 ms | 1,077 ± 50 ms |
| Native T2 | 83 ± 11 ms | 58 ± 4 ms |
| T2-weighted ratio | 4.1 ± 1.0 | 2.4 ± 0.6 |
| Extracellular volume | 50% ± 12% | 44% ± 14% |
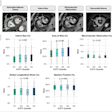
ROC analysis showed that native T1 and T2 mapping both had excellent values of 0.98 -- both significantly higher than T2-weighted ratio and extracellular volume fraction, Tahir said. Youden's values were used to establish cutoffs. Native T1 and T2 also showed greater sensitivity, specificity, and accuracy.
| Sensitivity and specificity of cardiac MRI protocols | |||
| Parameter (cutoff) | Sensitivity | Specificity | Accuracy |
| Native T1 (≥ 1,137 ms) | 97% | 98% | 96% |
| Native T2 (≥ 68 ms) | 90% | 100% | 94% |
| T2-weighted ratio (3.2) | 79% | 98% | 87% |
| Extracellular volume fraction (ECV) (≥ 38%) | 81% | 45% | 68% |
The group concluded that native T1 and T2 mapping are far superior to standard T2-weighted images and extracellular volume fraction for distinguishing acute from chronic myocardial infarction. And importantly, "native T1 and T2 values may be used as activity markers, enabling identification of culprit lesions in myocardial infarction and multivessel disease," Tahir said.
