While breast density and volume does not affect false-positive rates for computer-aided detection (CAD) software, CAD specificity is affected by breast fibroglandular tissue volume, according to research published online in the European Journal of Radiology.
In a study involving more than 200 patients with normal digital mammograms, researchers from Charité-Universitätsmedizin in Berlin found that patients with high fibroglandular tissue volumes had a higher mean number of false-positive mass marks and an increase in relative risk over those with low fibroglandular tissue volumes. No significant differences were found relative to breast density percentage or volume.
"This may have implications for improving the performance of CAD systems, as the specificity of CAD may be improved by adjusting the algorithm threshold depending on the volume of fibroglandular tissue present," wrote a team led by Dr. Florian Engelken. "Considering both factors, fibroglandular tissue volume and percentage density, independently, could improve overall CAD performance in subgroups of patients, e.g., those with small, dense breasts or large breasts with low density."
Seeking to determine the effect of breast percentage density, fibroglandular tissue volume, and breast volume on false-positive marks produced by a CAD system in full-field digital mammography (FFDM), the research team retrospectively studied 222 patients with normal digital mammograms and a minimum follow-up of 22 months from between 1 June 2002 and 31 August 2006 (EJR, 29 May 2012).
The mean patient age in the study was 54 at the time of first mammogram, with a range of 30 to 70 years. The patients had a mean percentage density of 23.7 ± 11.4% (range: 8% to 61%), a mean fibroglandular tissue volume of 98.5 ± 57.8 mL (range: 22 mL to 379 mL), and a mean breast volume of 455 ± 242 mL (range: 63 mL to 1564 mL).
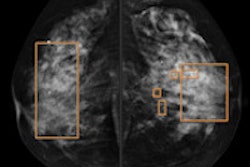
After assessment by version 9.3 of the R2 ImageChecker CAD software (Hologic), the exams were also processed by the R2 Quantra automated volumetric breast density assessment software (Hologic) to provide estimates on percentage density, fibroglandular tissue volume, and breast volume. The CAD and volumetric breast density assessment software were both run on a dedicated server that was integrated into the institution's PACS.
The researchers found that patients with large breasts and high percentage density had the most false-positive marks, while patients with small breasts and low percentage density had the lowest number. However, fibroglandular tissue volume had a statistically significant impact on specificity.
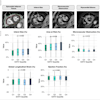
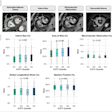
Mean number of false-positive mass marks per case by fibroglandular tissue volume (FTV)
|
The differences between the number of false-positives for high versus low FTV were statistically significant for the "balanced" and "sensitive" CAD settings (p < 0.05), the authors found. They did not discover any significant differences in the mean number of false-positive marks between patients with low, intermediate, and high percentage density or breast volume.
In addition, the relative risk for a false-positive mass marker increased by 1.43 (p < 0.05) on the "specific" CAD setting, 1.63 (p < 0.001) on the "balanced" CAD setting, and 1.50 (p < 0.01) for the "sensitive" CAD setting per 100 mL of fibroglandular tissue. No differences were noted in the relative risk for a false-positive mass marker based on percentage density or breast volume.
Although CAD sensitivity has been shown to drop due to masking of suspicious features by dense parenchyma, lowered specificity may be a function of the total volume of breast parenchyma, the authors noted. As a result, both breast density and breast parenchyma volume should be considered independently to optimize the sensitivity and specificity of CAD systems, according to the researchers.
"As the relationship between algorithm threshold and sensitivity and specificity is not linear, the 'cost' of increasing sensitivity in terms of specificity is much lower when sensitivity is low than when it is high," the authors wrote. "Therefore, the algorithm threshold of CAD systems could, for example, be lowered in small, dense breasts (intermediate FTV, low sensitivity, moderate specificity) to increase sensitivity at the cost of only a moderate decrease in specificity; in contrast, it could be increased in large breasts with low density (intermediate FTV, high sensitivity, moderate specificity) to improve specificity, thus improving the overall performance of the system."
