Radiation protection experts have developed a means of generating the size-specific dose estimate (SSDE) to assist management of the dose received by pediatric patients undergoing CT scans.
 Keith Strauss, chairman of the Pediatric Imaging Subcommittee at the American Association of Physicists in Medicine, at the 2011 International Pediatric Radiology meeting in London.
Strauss was co-chairman of the task group. He said the estimate was intended as an interim solution to help practitioners to better understand the actual doses delivered to their patients, and hopefully it would help them modify their CT scanning techniques to better manage the doses delivered.
"It should help radiologists identify the SSDE prior to the scan, and in so doing they will set diagnostic reference levels in their facilities that should not be exceeded. Scan technique can also be modified to lower the SSDE below the DRL [diagnostic reference level] prior to the scan," he explained.
According to Strauss, the radiologist needs to multiply a correction factor by the displayed the volume CT dose index (CTDIvol) to estimate the soft-tissue dose in the scan volume of the patient's tissues during the actual procedure.
Data were generated from four independent laboratories, which looked at the effect of patient size on the dose delivered during CT examinations. Essentially, those data were analyzed to result in correction factors contained within the report. "The report also contains some boilerplate text that radiologists can use if required, by their states, to provide a dose estimate with their CT examination report."
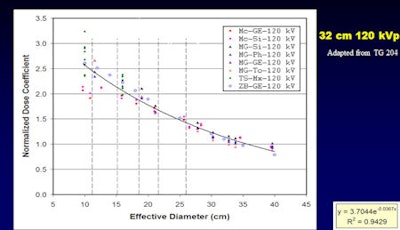 Graph plotting correlation factor multiplied by the CTDIvol against effective diameter of the patient. R2 = 0.94. Image courtesy of Keith Strauss; taken from AAPM report of Task Group No. 204.