Many hospitals make the decision to acquire CT perfusion technology and software primarily for stroke diagnosis; however, the technique can also yield valuable results in functional tumor imaging.
That's according to Dr. Ken Miles, chair of medical imaging at Brighton and Sussex Medical School in the U.K. Miles explained how to optimize CT perfusion protocols to produce accurate and consistent tumor imaging results at the 2009 European Congress of Radiology (ECR).
Examining the six main factors affecting iodine-enhanced tumor CT perfusion, Miles suggested specific parameters for optimizing image quality and minimizing radiation dose. He also noted some of the differences between different manufacturers' CT perfusion scanners and software.
Length/duration of CT scan
"The time and extent of the acquisition depends on what you are attempting to capture anatomically," Miles said. "However, first pass on CT perfusion can often be 45 to 60 seconds -- for example, for cerebral blood flow, cerebral blood volume, and mean transit time -- but at least 60 seconds when evaluating the liver."
The late phase can take one to 10 minutes, he added.
Frequency of slices
The key consideration is balancing image quality versus patient radiation dose. Many protocols suggest one image every second, although images can be produced every 0.5 seconds or more frequently with overlapping reconstruction. Studies have shown that in practice, however, the radiologist can reduce image frequency to every two to three seconds without compromising the accuracy of perfusion values.
"Ideally, we would just take images continuously to get the best quality and temporal resolution, but the more we do, the greater the radiation dose," Miles said. "If you set up the CT perfusion system to acquire images more rapidly [every two to three seconds] early in the scan, you can then reduce the frequency [to every five to six seconds] in the late phase."
Number and thickness of slices
Although the number of images in the z-axis is limited by the size of the detector track in many scanners, there is some scope for variability. For example, with a 2-cm track the radiologist produces four images of 5-mm thickness, or 2 x 10-mm images. In fact, two sets of images can be created from the same dataset, he said.
Table toggling, a function available on CT equipment by GE Healthcare (Chalfont St. Giles, U.K.), Siemens Healthcare (Malvern, PA), and Philips Healthcare (Andover, MA), enables the radiologist to move the table in and out during the acquisition.
"This allows you to at least double the acquisition volume in the z-direction; however, you may need to reduce image frequency to do this, depending on how fast the table moves," Miles explained.
The Aquilion One scanner by Toshiba Medical Systems (Otawara, Japan) does not use table toggling, the firm told AuntMinnie.com, calling the function "not necessary due to the coverage provided by the 16-cm-wide detector, enabling scanning of the brain within one, nonhelical rotation."
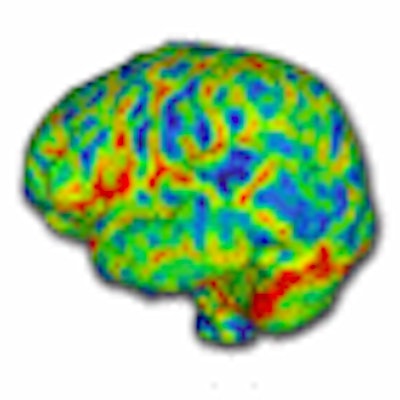
Toshiba's neuro One protocol allows acquisition of multiple low-dose volume scans of the entire brain during contrast infusion, to provide whole-brain perfusion and whole-brain dynamic vascular analysis in one examination, the company said.
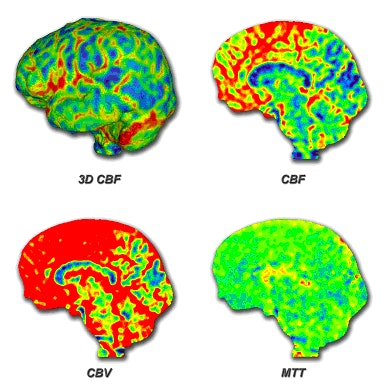 |
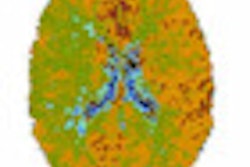
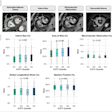
| Toshiba's whole-brain perfusion images in stroke patients. CBF = cerebral blood flow, CBV = cerebral blood volume, and MTT = mean transit time. Image courtesy of Toshiba. |
X-ray exposure factors
Several parameters in radiation exposure affect the quality and usefulness of CT perfusion images of tumors, as well as the safety of the patient.
Regardless of the scanner model, using a lower x-ray tube voltage is often better, Miles explained. "For any given iodine concentration, the greatest enhancement is produced at a lower tube voltage because you get more signal," he said. "Protocols increasingly recommend tube voltages of 80 to 100 kVp. A lower radiation dose for the patient is also an advantage."
He also noted that the often subtle, but sometimes significant, differences between manufacturers' technologies are an important consideration in x-ray exposure. For example, GE, Philips and Toshiba use a deconvolution method to calculate perfusion values, whereas CT scanners made by Siemens rely chiefly on the slope method.
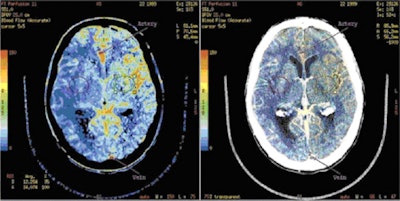 |
| An example of GE's CT perfusion analysis software, based on the deconvolution method of perfusion calculation. Image courtesy of GE. |
"With deconvolution, you can have a high image frequency and a lower tube current, whereas with the slope method, the accuracy of the measurement is more dependent upon the accuracy of two particular readings," Miles said. "It is therefore useful to have a lower frequency and a high tube current to get accurate measurements from the two time points when using the slope method."
He added that sensitivity to iodine varies among different manufacturers' systems, and in all machines, as they get used.
Contrast (iodine) concentration
There are several guidelines regarding iodine concentration:
- A high concentration (at least 350-400 mg/mL iodine) will produce more signal and greater enhancement.
- A fast injection rate (at least 4 mL/sec, but preferably 6-8 mL/sec) will produce a narrow vascular bolus, maximizing tissue contrast.
- Faster than 10 mL/sec has no additional benefit, due to the buffering effect in the system.
"In particular, you need to produce a narrow vascular bolus when using the slope method [Siemens]; otherwise, it is possible to underestimate perfusion if the transit time is short using the slope method," Miles said. "The deconvolution software [GE, Philips and Toshiba] can cope better with a contrast bolus that is more spread out; however, faster injection rates will always improve signal-to-noise ratios in the vascular space and tissue."
Image smoothing
Choose this option to eliminate noise and remove nontumor tissues (e.g., air, fat, calcium, and bone), according to Miles. In addition, the following points are worth keeping in mind:
- Removing highly enhancing pixels can eliminate blood vessels, but beware of removing tumor pixels simultaneously in highly vascular masses.
- Threshold values of 0 to 100 HU are effective for most tumors, but lung cancer assessments may require a range of -50 to 100 HU.
- When determining peak enhancement for lung scans, ask patients to breathe gently rather than trying to hold their breath -- this improves consistency.
Easy and useful
"For functional tumor imaging, CT perfusion is a relatively simple technique. It's easy to acquire the data as standard CT machines and iodine contrast agents are widely available, and it can be combined with other modalities such as radiotherapy planning and PET; plus, a range of commercial options [technology and software] exist," Miles concluded. "There are differences between different big manufacturers' CT perfusion technologies, but they're relatively minor."
He added that the same dataset would run through GE and Siemens software, for example, but the deconvolution method of calculating perfusion as used by GE and Toshiba is "completely different from Siemens and Philips, and it has advantages. There are benefits and disadvantages to both, however."
By Rob Skelding
AuntMinnie.com contributing writer
August 7, 2009
Related Reading
CT perfusion catches stroke cases that CTA misses, April 30, 2009
Perfusion CT predicts treatment response for pancreatic cancer, January 2, 2009
CT perfusion scan spots acute stroke in the emergency setting, November 5, 2008
New neuroimaging potential seen in 320-row CT, October 20, 2008
High blood flow to breast cancer tumors linked to high recurrence risk, October 16, 2008
Copyright © 2009 AuntMinnie.com


