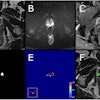
A new suite of investigational image-processing tools known as structure-analysis (SA) cleansing is improving the results of virtual colonoscopy scans performed after limited bowel preparation. The goal is to make virtual colonoscopy easier on patients and persuade them to get screened for colorectal cancer.
People aren't particularly fond of the cathartic bowel cleansing process generally required for conventional and virtual colonoscopy (also known as CT colonography or CTC). In fact, the uncomfortable prep is blamed for the low screening compliance rate. Fewer than half of adults in the U.S. are ever screened for colorectal cancer once they reach the age of 50.
But if so-called electronic cleansing (EC) of CTC datasets can succeed in virtually removing the fecal material in the colon without also eliminating the soft-tissue data, patients could skip the heavy-duty prep, undergo a noninvasive CT scan, and let the EC software take care of the rest.
"One of the fundamental questions about CT colonography or virtual colonoscopy is if fecal material remains in the colon, what happens to the polyp underneath it?" Hiro Yoshida, Ph.D., said at the Computer Assisted Radiology and Surgery (CARS) meeting in Berlin.
The tools eliminate the most common artifacts associated with electronic cleansing, improving the results compared to simple threshold-based EC methods, said Yoshida, who discussed the first results of an ongoing clinical trial on which he is collaborating with Dr. Michael Zalis, Janne Näppi, Ph.D., and Wenli Cai, Ph.D., from Massachusetts General Hospital and Harvard Medical School in Boston.
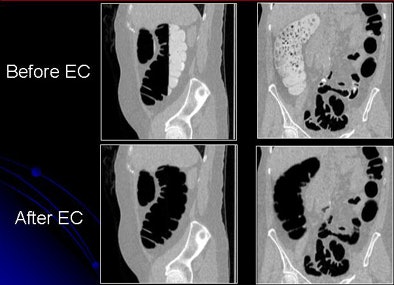
Electronic cleansing is the process of marking fecal material that has been tagged with the use of oral barium or iodine, and removing it from CTC images to "virtually cleanse" the colon and enable examination of the data, Yoshida explained.
The basic steps involved in EC include segmenting the CT colon data from the rest of the anatomy, characterizing tagged voxels and digitally subtracting them from CT images, and removing the boundary between the lumen and tagged regions. Finally, the layer of colonic wall with the tagged region is reconstructed to the layer with the lumen.
 |
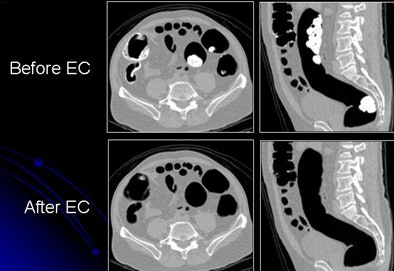 |
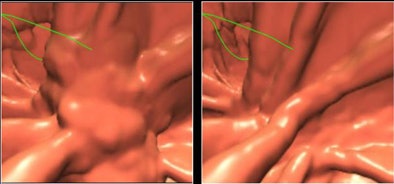
| Images show CTC data before and after electronic cleansing. All images courtesy of Hiro Yoshida, Ph.D. |
 |
Since 2004, research teams have been hard at work refining their methods to improve the quality of reconstructed data and minimize artifacts, leading to increasingly sophisticated algorithms and better EC results.
The general assumptions in EC development are that residual feces are fluid rather than solid, that tagging is homogeneous, and that bowel cleaning is rigorous, Yoshida said. But the reality is quite different. CTC exams come with widely divergent levels of quality in tagging and cleansing. A wide variety of bowel preparation techniques and agents are emerging for use in CTC, he said.
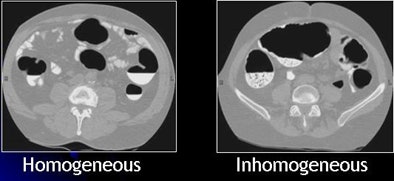 |
| Inhomogeneous tagging often appears in reduced or nonlaxative CTC. The uneven appearance of tagged materials on CTC data represents a mixture of semisolid fecal materials, air bubbles, fat, undigested foodstuffs, and unevenly distributed contrast agents. |
Inhomogeneous tagging often appears in reduced or nonlaxative CTC data, resulting from a mixture of semisolid fecal materials, air bubbles, fat, undigested foodstuffs, and unevenly distributed contrast agents.
"And it causes a few problems for electronic cleansing," Yoshida said, noting three principal types of artifacts produced by such unevenly tagged residual materials:
Soft-tissue structure degradation, caused by pseudoenhancement -- or artificially increased tissue density due to the adjacent high-radiodensity tagging. In practice, this often results in colonic mucosa being dismissed as enhanced fecal material, Yoshida said.
Pseudopolyps and false fistulas, caused by the similarity between the air-tagging boundary and the thin, soft tissue and the partial-volume effect in CT. This phenomenon can "virtually erode" the mucosal structure "and put a false fistula or hole in the colonic wall" that doesn't exist in the patient, he said.
Undercleansing, resulting in "stalactite" artifacts from unenhanced fecal materials in the dataset.
Structure-analysis cleansing
"We are introducing a robust electronic cleansing method called structure-analysis cleansing that incorporates several steps to get rid of those artifacts corresponding to artifact types 1, 2, and 3," Yoshida said.
The SA process incorporates morphological (soft-tissue) enhancement to reduce type 1 artifact (soft-tissue degradation), local roughness analysis to reduce type 2 artifact (pseudopolyps and fistulas), and mosaic decomposition to reduce type 3 (undercleansing or stalactite artifacts). Mosaic decomposition was described for the first time at the 2009 CARS meeting, accompanied by a study abstract.
Morphological enhancement
Morphological enhancement was designed to determine which part of a tagged region should be preserved, Yoshida said.
"Structures with a rutlike shape, representing submerged folds, and cuplike shapes, representing submerged polyps, are enhanced while other structures are de-enhanced," he said. "Based on characterizing those cuplike and rutlike structures, we are able to come up with enhancement functions."
The method uses local morphologic structure based on eigenvalue signatures of the 3D Hessian matrix (H) of a volume (I) to enhance the morphology of the mucosa.
 |
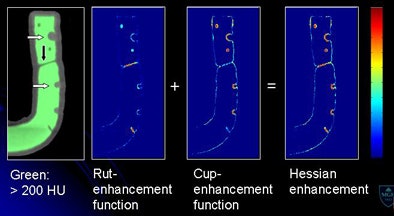 |
| Morphological enhancement is designed to determine which part of the tagged region should be preserved. Structures with rutlike shapes (submerged fold) and cuplike shapes (submerged polyp) are enhanced, while other structures are de-enhanced. Morphological enhancement uses local morphologic structure based on eigenvalue signatures of the 3D Hessian matrix (H) of a volume (I) (above). Submerged folds and polyps are enhanced by a combined Hessian enhancement function (below). |
 |
Local roughness analysis
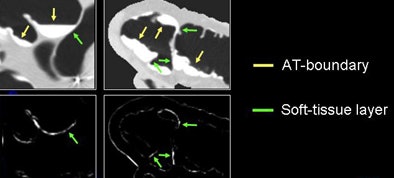
The next process is local roughness analysis, which is designed to determine whether the voxel being analyzed is on top of a thin soft-tissue structure between a tagged region and air (tagging-tissue-air layer), or an air-tagging boundary (AT-boundary), Yoshida said.
The surface of an AT-boundary is more irregular than a tagging-tissue-air layer because of local nonlinear volume averaging and/or semiliquid nature of the tagged fecal materials. Characteristics of the curvedness across scales can be used to differentiate the two types of boundaries.
"By using only the CT gradient, you're not able to differentiate them, but if you ... calculate the curvedness, which is essentially the curvature of the voxel, the AT-boundary has a different profile," Yoshida said.
Thus, the local roughness function measures the local surface irregularity to distinguish the structures. The local roughness response function enhances soft tissue in the tagging-tissue-air layer while suppressing the AT-boundary. As a result, "the soft-tissue density is preserved by applying this approach, and the AT-boundary is eliminated," Yoshida said.
 |
 |
| Local roughness analysis is designed to determine whether a voxel is part of a thin soft-tissue structure between a tagged region and air (tagging-tissue-air layer) or an air-tagging boundary (AT-boundary). The surface of an AT-boundary is more irregular than that of a tagging-tissue-air layer due to local nonlinear volume averaging and/or the semiliquid nature of the tagged fecal materials. Characteristics of the curvedness across scales can be used to differentiate the two types of boundaries. The local roughness function measures the local surface irregularity. Application of the local roughness response enhances soft tissues in the tagging-tissue-air layer and suppresses the AT-boundary. |
 |
Mosaic decomposition
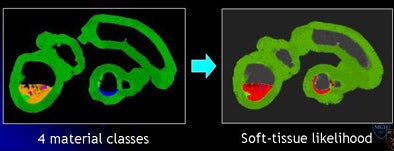
Mosaic decomposition was designed specifically to remove type 3 artifacts and consists of three main steps: decomposition of inhomogeneously tagged materials into locally homogeneous "tiles," classification of each tile into one of four distinct materials classes to derive a so-called "soft-tissue likelihood," and weighting of the Hessian enhancement function with the soft-tissue likelihood.
In mosaic decomposition the colonic lumen, including the residual fecal regions, is decomposed into a set of local homogeneous regions, known as tiles, after applying a 3D watershed transform to the gradient of virtual colonoscopy images.
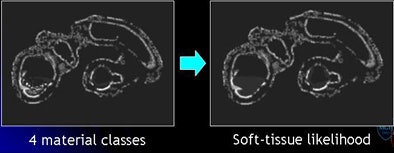
"We extract some features out of these [tiles] by using a series of SVMs, support vector machines," Yoshida explained. "We are able to differentiate these small tiles into four materials classes including air represented by black, fat represented by magenta, and contrast agent -- essentially fecal material being contrasted -- as yellow, and then the soft-tissue density which is shown by green."
By using the combined "committee" of SVMs, the algorithm generates a "soft-tissue likelihood" map with green as the likely soft tissue contrasted with red, representing areas less likely to be soft tissue. In the final step, the soft-tissue likelihood results are used to weight the Hessian enhancement functions to remove erroneous enhancement due to inhomogeneous tagging.
In 237 fecal-tagging CTC datasets, addition of the mosaic decomposition scheme alone reduced the number of false positives in a threshold-based cleansing algorithm from an average of 4.7 false positives per scan to 2.7 false positives per scan.
 |
| The mosaic decomposition process is designed to remove type 3 (undercleansing) artifacts. The colonic lumen, including the residual fecal regions, is decomposed into a set of local homogeneous regions, i.e., tiles, after applying a 3D watershed transform to the gradient of CTC images (above). Texture features plus SVMs are used to classify each tile into one of four material classes: (1) air (black); (2) fat (magenta); (3) contrast agent (yellow); and (4) soft tissue (green). Committee of SVMs is used to generate soft-tissue likelihood (below). The soft-tissue likelihood is used for weighting the Hessian enhancement functions to remove erroneous enhancement due to inhomogeneous tagging (bottom). |
 |
 |
The per-polyp sensitivity increased from 60% (threshold cleansing) to 90% (materials decomposition cleansing) the authors reported in an abstract. "Visual assessment confirmed that reduction of false positives and false negatives occurred because of the reduced artifacts due to incomplete cleansing of heterogeneous tagging," they wrote.
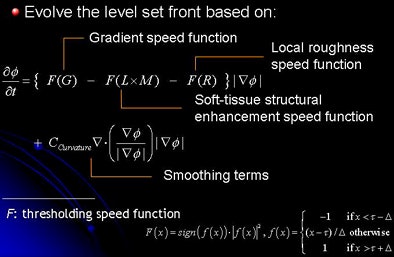 |
| The SA process consists of marking the colonic regions, followed by structure analysis of the colonic lumen. Morphological enhancement (M), local roughness response (R), and soft-tissue likelihood in mosaic decomposition are calculated. Next, the level set method is applied with speed functions derived from structure analysis. The level set front is initialized with tagged regions defined as greater than 200 HU, and then tagged fecal materials are segmented and removed. |
Yoshida also offered a first look at results from the ongoing laxative-free CTC trial at Massachusetts General Hospital. The analysis included 237 selected patients on whom all three SA techniques were applied before processing in a computer-aided detection (CAD) system optimized for cleansed, nontagged CTC.
All 237 patients underwent a nonlaxative, two-day bowel preparation consisting of a low-fiber, low-residue diet (NutraPrep, Bracco Diagnostics, Princeton, NJ) and oral administration of 7.5 mL nonionic iodinated contrast agent (Omnipaque, GE Healthcare, Chalfont St. Giles, U.K.) with each meal and snack. Patients were scanned prone and supine on an MDCT scanner at 70 mAs and 140 kVp, using 2.5-mm collimation and a 1.25-mm reconstruction interval.
The 237 datasets contained a total of 44 polyps 6 mm or larger and six polyps 10 mm or larger. CAD sensitivity was 100% for all 50 findings, Yoshida reported.
Early results show that CAD sensitivity is improved significantly with the use of SA cleansing, though not all artifacts are eliminated, said Yoshida, adding that "the real impact is in polyps 6-9 mm" rather than polyps larger than 10 mm that are already easier to find. Reader trials are currently under way using the new techniques.
By Eric Barnes
AuntMinnie.com staff writer
August 3, 2009
Related Reading
Topographical height mapping moves mountains in polyp detection, July 27, 2009
Minimal prep VC nearly as sensitive, better tolerated, March 7, 2009
Image tools cut false positives in unprepped VC, August 4, 2008
VC CAD finds polyps in prepped or unprepped patients, May 6, 2008
CAD beats human readers in multicenter trial data, November 19, 2007
Copyright © 2009 AuntMinnie.com

