New software that analyzes bone age and health from hand radiography has revealed fresh information about changes in bone density and osteoporosis over a lifetime, according to a German-Danish research group.
A team from bone-health software provider Visiana, along with colleagues in Jena, Germany, and Copenhagen, examined more than 1,600 hand radiographs to diagnose osteoporosis and progression of rheumatoid arthritis. The analysis also included hand radiographs from a prior longitudinal study of 116 Danish children (Archives of Osteoporosis, April 26, 2016).
Bone analysis was based on a novel digital x-ray radiogrammetry (DXR) method with reference curves of four indexes of cortical bone. This update of Visiana's BoneXpert software used the DXR method to form the reference curves for the indexes. Among them, the bone health index was the most accurate, having the smallest relative standard deviation.
The software makes it possible to study the relationships among the four measured indexes and the occurrence of fractures, wrote lead author and Visiana owner Hans Thodberg, PhD, and colleagues from Jena University Hospital and the University of Copenhagen School of Dentistry.
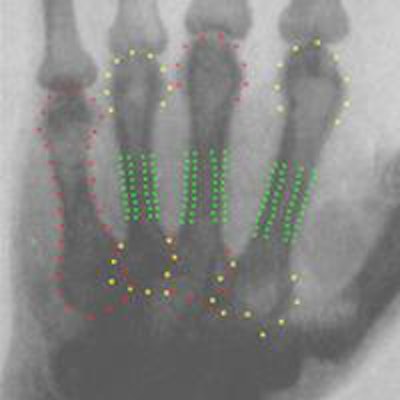
The new version "is a more powerful method for locating the bones in the image," he noted in an email to AuntMinnieEurope.com. "The previous method located only the shafts, while the new approach locates the entire contours of the four metacarpals, and it does so very robustly."
And the software offers automated computer-aided detection (CAD) results in almost every case.
"Only for 3% of the images does it ask for visual confirmation by an expert, and these cases often contain abnormalities worthy of the attention of the radiologist," Thodberg wrote. "This kind of intelligence should be expected from modern CAD software."
Implemented as a local CAD server, the software exports the image from PACS to the server, which returns the analyzed image in seconds to PACS, explained Thodberg and colleagues Joachim Böttcher, Jens Lomholt, Sven Dr. Kreiborg, and others.
Old and new
The classical method for assessing skeletal status is measuring the cortical thickness in metacarpals from radiographs, a technique that gained prominence with Visiana's 2011 introduction of DXR. The study involves using a technique for adults that is derived from the pediatric version and contains new features:
- The region of measurement extends to the ends of the metacarpals, scaling size precisely to bone length.
- Four different indexes of cortical bones are tracked -- in anticipation of future studies in which each index will be able to be compared with cortical bones separately.
- Retrospective data were used for training (Jena study of subjects 9 to 100 years of age imaged after trauma) These data assessed the transition from childhood to adulthood and were used to form the reference curves for DXR bone mineral density studies.
- Better image analysis permits analysis of a wider range of images; the software requires visual inspection in 3% of cases.
- Features better workflow, as the DXR analysis engine is implemented as a local service for PACS users. PACS users can export a hand radiograph to the DICOM node, which analyzes the image and returns an annotated DICOM image to PACS for storage with the original.
Image analysis
Thodberg and his team used machine learning to derive the mathematical models for the image analysis method from the shape and appearance of the bones in the Jena radiographs. They manually traced the contours of bones in 200 subjects, using an automated method to mark the contours at anatomically corresponding locations in the cohort.
This study used shape models of metacarpals 2 to 5 from patients ranging in age from 16 (girls) and 18 (boys) up to 90 years old. While reconstructing bone contours, the technique derives a "misfit" score representing a deviation of the observed image from what is expected in the trained image model. The outcome of the analysis is divided into three classes based on the misfit threshold: accepted images, questionable images, and rejected images.
After excluding 25% of images in the Jena study that were incomplete, an additional 3% (and 2.5% in the Danish Björk study) were classified as questionable, owing to deviation from the standard hand pose, age older than 80 years, etc., the team wrote.
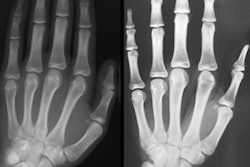
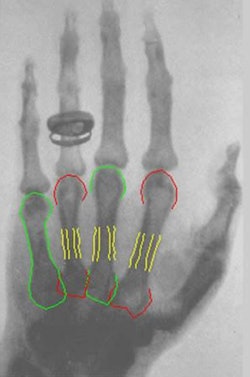 X-ray of 78-year-old patient (von Kölliger) acquired by Conrad Röntgen on January 23, 1896. The image was analyzed with the DXR method, yielding a metacarpal index of 0.64, which translates into a Z score of 2.4. Image courtesy of Hans Thodberg, PhD.
The four indexes are listed below:
- Bone health index (BHI)
- Metacarpal index (MCI)
- Exton-Smith index (ESI)
- Cortical volume per area (VPA)
BHI had a relative standard deviation of 7.5% in children, while the others had a deviation about 8.5%, demonstrating broadly compatible results in all three populations.
For adults, all four indexes are often equally useful, for instance for assessing progression of rheumatoid arthritis, Thodberg noted. The metacarpal index is dimensionless and, therefore, necessary if the magnification factor of the exposure is not controlled, as was the case for von Kölliger's hand image, he wrote.
Some might prefer the volume per area index, because it is proportional to area bone mineral density, Thodberg explained. Using the original DXR implementation, this bone mineral density was shown to predict fractures in a 2013 study of 8,000 patients, of whom 122 had hip fractures.
BHI comes out ahead
As noted, the bone health index had a smaller relative standard deviation than the metacarpal index and the Exton-Smith index (p < 0.01), which, in turn, were slightly below that of cortical volume per area. Specifically, the relative standard deviation was 7.4% for patients 20 to 40 years of age, close to the 7.5% found in children, but rising to 9.7% in individuals 60 to 80 years of age.
Overall, the Danish (Björk) bone health index data were consistent with the Jena data and the BHI reference data for healthy children, the authors reported.
The Björk subjects had about a 1% higher BHI than the Jena cohort at all ages. But with 116 subjects and a relative standard deviation of 7.5%, the difference would have had to be 1.4% or greater to be significant.
How will the results improve bone assessment clinically?
"Locating the ends of the metacarpals allows the method to define a more anatomically correct measurement region on each bone, placed relative to the ends of the bone, and with a size scaled to the bone size," Thodberg wrote. "Patients can, therefore, be followed longitudinally from infancy to old age using a consistent method with reference curves for estimating Z scores."


