A newly revamped lung computer-aided detection (CAD) algorithm has shown outstanding accuracy in a study of lung lesions from a database and generated few false positives, according to a study published online on 24 July by European Radiology.
Results from the University of California, Los Angeles (UCLA) study showed high precision and a very low false-positive rate of zero to two findings per case when the investigational CAD scheme developed at the university was applied to lesions from the Lung Imaging Database Consortium (LIDC) CT reference dataset. The results make the algorithm one of the first with the potential to be efficient and helpful enough to use in day-to-day clinical practice, the authors noted.
"One of the key breakthroughs of this paper was that we were able to attain high sensitivity while having a median false-positive rate of zero, with an interquartile (ICQ) range of one or two," said lead author Dr. Matthew Brown in an interview with AuntMinnieEurope.com. "What that means for a physician trying to use this in practice is that they would observe, in most cases, zero false positives."
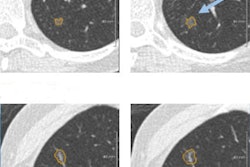
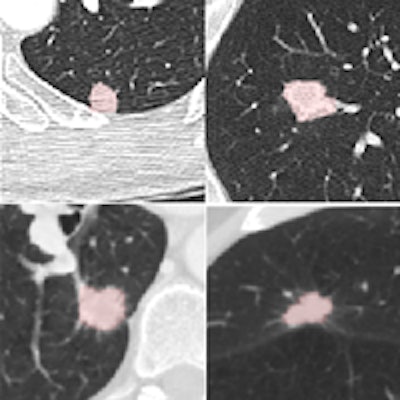
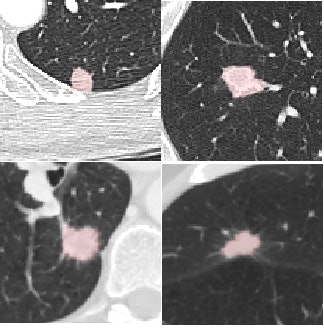 Four reference nodules from the LIDC dataset that were automatically detected and segmented by the CAD system. Color overlay shows the automated segmentation result from the system. Images courtesy of Dr. Matthew Brown.
Of course, getting near-perfect results on nodules from a database is a long way from getting the same results in daily clinical practice, where patients are breathing and image quality is variable, he cautioned. But the results of this study, in the algorithm that the team has been working to perfect since 2000, are very encouraging -- and those real-world tests are already underway.
"UCLA owns the technology and has licensed it, so I know that the people that have commercialized it now are running it at a number of hospitals," Brown said. "I'm not involved in this independent work, but I'm hearing that the feedback they're getting clinically is very positive so far."
With widespread lung cancer screening with CT apparently just around the corner from implementation in the U.S., radiologists need efficient CAD systems to detect true nodules representing possible malignancies quickly and efficiently -- and they need them to function without a lot of false positives. But previous techniques have been cumbersome and time-consuming due to their penchant for confusing nodules with blood vessels.
"One of the big limitations of CAD is that it's had too many false positives while trying to maintain a high level of sensitivity -- and we think that in a busy practice, probably even three, four, five, or 10 false positives is probably too many, as high as that bar may seem technically, Brown noted, and the CAD system was tailored to work only on nodules 4 mm and larger -- the minimum size that could be considered positive in the recent National Lung Cancer Screening Trial, for example.
It's important that this study aimed to define clinically relevant CAD requirements and protocols based on the results of recent screening trials, because other studies have suffered from taking aim at nodule targets that were too small, according to Brown. This CAD avoids that problem by refusing to process when image resolution is too low for accurate analysis of a potential malignancy with the CAD's intensity and shape filtering functions.
Because the smallest symmetric 3D filter kernel size is 3 x 3 x 3 voxels, a nodule must appear on at least three axial slices to be visualized without partial volume effects, which complicate the task of distinguishing nodules from blood vessels, the authors explained. For that reason the minimum nodule size of 4 mm for a 1-mm slice thickness was established for the system. Lacking sufficient resolution, the algorithm doesn't attempt to analyze it. For a CT image with a 2-mm slice thickness, the minimum size for analysis would be 8 mm, Brown and colleagues noted.
The study used CAD to analyze CT scans of the 108 LIDC subjects acquired with slice thicknesses and reconstruction intervals ranging from 0.5 mm to 3.0 mm (mean 2.1 mm), mAs ranging from 75 to 300, and kVp ranging from 120 to 140. The investigators chose a wide variety of nodules types from the LIDC database to show the range of nodule types detected in practice. Samples varied in size (from small to large), shape (including round, irregular, speculated, and cavitated), and connectivity from isolate to contacting vessels and pleura. Scanner manufacturers included GE Healthcare, Siemens Healthcare, and Toshiba Medical Systems.
CAD steps
Following intensity thresholding, the CAD algorithm incorporates Euclidean distance transformation (EDT) and segmentation function based on watersheds (which analyze the grayness of pixels), as well as a connected component analysis to ensure correct segmentation, Brown and colleagues noted.
The EDT function defines the value of a voxel as the minimum distance from that voxel to another that is not included in the threshold, and the system then detects nodule candidates by watershed segmentation of the EDT image, they wrote. Three-dimensional seeded region growing is then used to include all contiguous voxels within the threshold of the local EDT maxima.
"This step prunes contacting vessels from nodule candidates while preserving the elongated shape if the seed is within a vessel," the authors wrote. Finally, the CAD applies volume and shape rules to further help distinguish nodules from vessels. The system reports several nodule size features, including volume, volume equivalent diameter, longest diameter, and mean attenuation of region of interest voxels in Hounsfield units.
From the LIDC database of nodules analyzed by the CAD, only findings considered nodules by a majority of the four radiologist readers who originally evaluated the nodule were included for analysis by CAD. Findings were rated true positive, false negative, or false positive.
High accuracy
The detection results showed that median sensitivity per subject was 100% (± interquartile range [IQR] 37.5) for nodules 4 mm and larger. For nodules 8 mm and larger, median sensitivity per subject was 100% (± IQR 8.0). The concordance correlation coefficient between the CAD nodule diameter and the LIDC reference was 0.91, and for volume it was 0.90, the authors wrote.
| CAD false positives | ||
| False positives per subject | Nodules ≥ 4 mm (Volume ≥ 34 mm3) |
Nodules ≥ 8 mm (Volume ≥ 268 mm3) |
| Number of subjects | 108 | 108 |
| Median (± IQR) | 0 (± 2.0) | 0 (± 1.0) |
| Mean (± Standard deviation) | 2.05 (± 5.32) | 1.01 (± 2.40) |
The authors tested the CAD on 4 mm and larger lesions per NLST criteria and also on nodules 8 mm and larger, because NLST investigators found almost no malignancies at the lower 4 mm or larger size range, Brown said.
"We also reported for 8 mm or larger nodules because we think that ultimately the end target will end up being between 4 and 8 mm, and performance improves dramatically as you increase the size of the target," he said. "What's different with the NLST and Nelson results is that there's a much better feel for what size nodule is appropriate to detect -- 4 mm and above makes the problem a lot more tractable and that was a big factor in tailoring the algorithm to that size nodule."
The results show that the CAD system has reliable enough measurement tools for routine clinical use, with high sensitivity and a very low false-positive rate. "Worst case, you would see one or two false positives per case, and we're very excited by that result, because it does open the door for a system that you actually might want to use clinically," he commented.
More work ahead
This study is certainly a big step forward, but it was performed on a limited dataset in a setting different from real-world practice, Brown said. "When you roll this out broadly, you have variations not only in image quality but also variations in terms of the extent of disease," because these kinds of pristine datasets don't exist in clinical practice, he said "They get all kinds of scans thrown at them, and I think this is going to be one of the next challenges as this gets rolled out clinically."
Also, image quality remains a huge factor in real-world CAD performance. "CAD performance doesn't occur in a vacuum; it is highly dependent on image quality, so we explicitly included image quality in way CAD works," for example, but making the CAD exclude nodules with insufficient image quality from analysis. Still, CAD systems will ultimately need to be combined to look for different kinds of disease beyond nodules to reach their potential, he said.
That means "incorporating additional CAD that finds other diffuse lung abnormalities that confound nodule detection," Brown said. If other disease is present, it can lead to false positives -- "findings that appear somewhat nodular but are really part of other disease processes," he said. Brown and colleagues will do some of that work themselves, and the vendor partner also has plans to incorporate the algorithm with CAD that finds other abnormalities.
Such a product, faced with non-nodular abnormalities within the lung, "could exclude that case and say it found other disease and is not even going to look for nodules there, or it can filter out certain portions of the lung that are known to have other things going on," Brown said. "Putting this into a comprehensive package that excludes other abnormalities will be a really important step for CAD as you try to roll it out for clinical practice."
