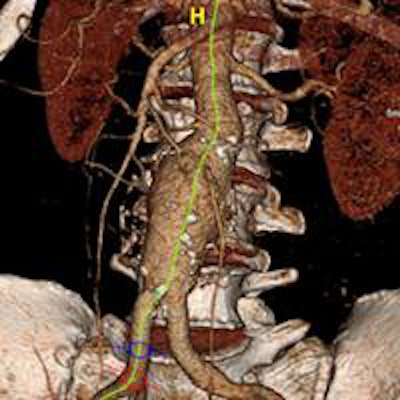
Using 3D workstations for planning endovascular aneurysm repair (EVAR) of abdominal aortic aneurysms (AAA) can improve both short- and midterm outcomes for patients, researchers from Lille University Hospital in France have found.
After adoption of a 3D workstation for performing endograft sizing, the institution achieved a significant reduction in the rate of dangerous type 1 endoleaks after infrarenal EVAR. The researchers reported their findings in an article published in the European Journal of Vascular and Endovascular Surgery (October 2013, Vol. 46:4, pp. 418-423).
"A 3D workstation is mandatory to accurately assess the anatomy of the aorta and its branches for precise EVAR planning," senior author and vascular surgeon Dr. Stéphan Haulon, PhD, told AuntMinnieEurope.com. "The routine use of [a 3D workstation] is associated with higher technical success during endografting and better outcomes during follow-up" -- i.e., a reduction in secondary procedures.
Cost is an issue
While there is a worldwide trend toward systematic use of 3D workstations for EVAR planning, the cost of the technology remains an issue, Haulon said. As a result, the researchers sought to demonstrate the clinical utility of 3D workstations by analyzing results of patients undergoing infrarenal EVAR at their hospital between 2006 and 2009.
Prior to 2008, preoperative aortic measurements for endograft sizing were estimated by serial examination of the axial CT angiography images (CTA). As of January 2008, CTA analysis and endograft sizing at the institution is now performed using the Aquarius iNtuition Viewer (TeraRecon).
With the 3D workstation, a semiautomated centerline algorithm generates a "centerline of flow" reconstruction to assess aortic morphology. The workstation then calculates measurements such as the diameters of the aorta at the level of the lowest renal artery, the aortoiliac bifurcation, and the distal iliac arteries. It also determines the longitudinal distances between the lower margin of the lowest renal artery and the aortoiliac bifurcation, as well as between the lower margin of the lowest renal artery and both common iliac arteries, according to the researchers.
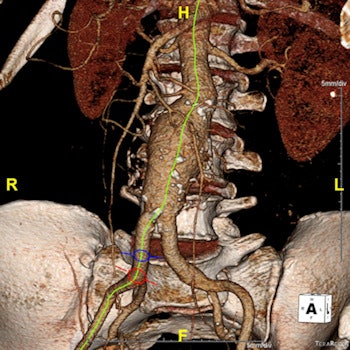
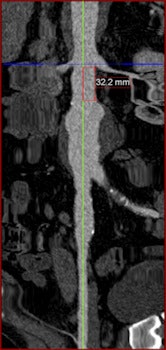 Left: Centerline-of-flow (green) generated by the 3D workstation. Right: Stretched curved planar reformation (CPR) view of same image. This view was generated to accurately measure infrarenal AAA neck length. All images courtesy of Dr. Stéphan Haulon, PhD.
"The diameters measured in this group are the maximal diameter measured within the orthogonal plane, perpendicular to the centerline of flow," they wrote.
A total of 326 patients were treated with EVAR for infrarenal AAA during 2006 to 2009; 295 patients completed a minimum of two-year follow-up and were included in the study. Patients routinely received contrast-enhanced CTA prior to discharge. Post-discharge follow-up included an ultrasound examination at six months and contrast-enhanced CTA associated with plain abdominal radiography at 12 months. In the absence of renal function impairment, ultrasound and contrast-enhanced CTA were then repeated annually.
Of the 295 patients, 148 received endograft sizing by analysis of CTA images, while 146 had endograft sizing performed via the 3D workstation.
No significant difference was observed in the preoperative characteristics of the two groups of patients, and CTA was performed on all patients using a Brilliance 64-slice CT scanner (Philips Healthcare).
| 2-year period following EVAR | ||
| Endograft sizing via serial analysis of CTA | Endograft sizing using 3D workstation | |
| Type 1 endoleak rate | 8.7% | 1.4% |
| Secondary intervention rate | 5.4% | 0% |
The differences were statistically significant (p = 0.004 and p < 0.001, respectively).
"The institution has observed a statistically significant reduction in type 1 endoleaks since routinely using a 3D workstation for EVAR planning," Haulon said. "These endoleaks often require bringing the patient back to the hybrid room for a secondary intervention and thus are associated with a prolonged hospital stay. Type I endoleaks are also associated with aneurysm rupture following EVAR."
The researchers did not find, however, a statistical difference between the two patient groups for all-cause mortality, aneurysm-related death, and freedom from secondary intervention rates during follow-up.
The researchers noted that multidetector-row CT and 3D workstation analysis have now replaced the old gold standard of intra-arterial digital subtraction angiography for assessing the length of abdominal, thoracic, and cranial vasculature.
"3D workstations are now intuitive and 'user-friendly,' which makes them accessible to vascular surgeons and radiologists alike," the authors wrote. "The results from our study demonstrate that these tools are mandatory in everyday practice to enhance midterm EVAR results."


