Prototype software that automates the identification, measurement, and tracking of cancerous lesions has shown its potential to make interpretation of CT scans faster and less tedious for radiologists, according to study results published online on 29 June in European Radiology.
The commercialization of automatic lesion tracking software would be good news for radiologists working at cancer treatment centers. It is their responsibility to evaluate the success of treatment, or lack thereof, on chemotherapy being given to cancer patients to reduce tumors. The process of comparing images acquired from multiple CT scans can be time-consuming and demanding.
A multi-institutional team of radiologists working at four hospitals in Germany evaluated an automatic lesion tracking tool from Fraunhofer MEVIS, the Institute for Medical Imaging Computing in Bremen. The computer-aided detection (CAD) software has been in development since 2009.
How it works
The software currently offers semiautomatic segmentation methods for lung nodules, liver metastases, and enlarged lymph nodes. A user initially identifies a lesion and draws a line across it, which initiates an initial segmentation within one to three seconds depending upon the size and complexity of the lesion. When the user draws a partial contour in a single image slice to add or remove parts of the segmentation, adjacent slices are also modified accordingly.
When the tool is used to compare the size and volume of a lesion imaged during two or more CT scans, it automatically processes the subsequent images and compares the segmentation results for both baseline and follow-up images. Users may choose if information is displayed in purely geometric or image-based with respect to manual refinement of segmentation results.
If a tumor has disappeared, or if a large number of lesions are visible in a single image, the algorithm does not prepare results. Whether the algorithm should automatically filter out implausible results is a matter of debate among users.
The study
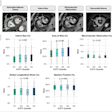
Four radiologists representing a range of experience were asked to perform volumetric follow-up examinations for 52 baseline and follow-up CT exams that contained 139 lesions (47 lung, 49 liver, and 43 lymph nodes). The lesions spanned a wide range of volumes, growth, and shrinkage. The radiologists interpreted the pairs twice, one of the times using the tool. When the tool was enabled, each radiologist could accept the result, refine contours, or completely delete the result and start a new segmentation by drawing a stroke.
Exams were interpreted over the course of two days, using the tool with half of the exams each day. Regardless of whether this was the first or second time the radiologists had seen the exams, reading times were considerably faster for exams where the tool was activated. When initially viewed with the automatic tracking tool, interpretation was faster for 66% of the cases, and when combined with review times of exams seen previously when the tool wasn't used, interpretation times were less for 79% of the cases.
Inter-reader variability of volume measurements also was reduced. There was no variability at all for more than 70% of the lesions when all radiologists accepted the precomputed segmentation. The average segmentation quality was comparable, with a balance of cases in which the software outperformed the radiologists and the radiologists outperformed the software, according to lead author Dr. Jan Hendrik Moltz from Fraunhofer MEVIS -- Institute for Medical Image Computing, in Bremen, Germany.
Overall, the results of real-world testing of the software showed promise, the authors wrote, and they recommended that additional, more detailed studies be undertaken with a larger group of participating radiologists in clinical settings.
