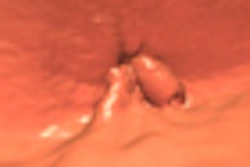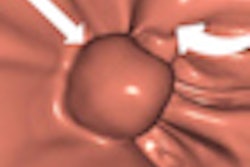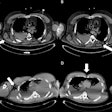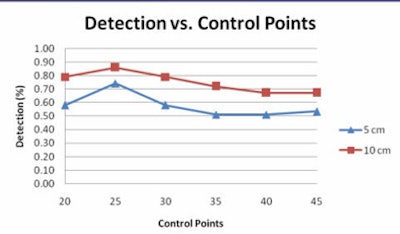
Large polyps found at virtual colonoscopy (also known as CT colonography or CTC) are referred to optical colonoscopy for removal, and that's generally the end of the story. But CTC-detected polyps can't always be found quickly and easily at colonoscopy, so an automated method of finding them might be just what the gastroenterologist ordered.
Researchers from the U.S. National Institutes of Health (NIH) in Bethesda, MD, said they've found a way to more accurately determine where CTC-detected polyps can be found at colonoscopy, potentially saving time and reducing risk to patients undergoing polypectomy.
"It's important to accurately locate polyps found at CTC at the subsequent optical colonoscopy [OC], if you're going to have a successful screening program," said the NIH's Ron Summers, MD, PhD, at the 2010 Computer Assisted Radiology and Surgery (CARS) meeting held earlier this summer in Geneva. To find them, "we can't just use the length of the colon at CTC as our coordinate system for finding where the polyp would be at OC," he said. The physical characteristics of the colonoscope render the two measurements completely different.
"Because the scope is semirigid, it tends to straighten out the colon and changes the apparent length of the colon such that the colon length at CTC is, on average, 80% longer than the colon length measured at optical colonoscopy," Summers said. "And because the colonoscope tends to flatten out the colon, the shape is very different between the two exams."
Evening out the measurements
Last year the researchers published a method of matching CTC-detected polyp locations to OC polyp locations using a method they called the "normalized distance along the colon centerline," or NDACC. Rather than simply computing the raw distance along the colon, NDACC employs a normalized distance calculation by which the rectum is 0 and the cecum is 1 in the coordinate system.
But the method needed a little tweaking, so researchers Kevin Chang, PhD; Jiamin Liu, PhD; Jianhua Yao, PhD; and Summers decided to incorporate a B-spline curve-fitting method to model the physical characteristics of the semirigid colonoscope in the present study.
The new B-spline method relies on two assumptions: first, that the path of the colonoscope is straighter than the centerline of the colon at CTC, and second, that the straightened paths could be estimated using B-spline curve fitting, as follows:
- Automated centerline extraction for CTC
- A fifth-degree B-spline curve is fitted to the CTC centerline; all points of CTC centerline are used as control points
- Uniformly resampling the first B-spline, and resampled points are used as control points for a second fifth-degree B-spline curve fitting
Using the 3D colon surface at CTC, the first B-spline estimates are computed to create the sample, Summers said. Then linear interpolation is used to identify polyp locations along the centerline, and, finally, the predicted locations are compared to the true location at optical colonscopy.
The team tested the method on 87 unique polyps from 72 patients. The polyps were divided into training (n = 43) and testing sets (n = 44), and the training set was used to optimize the number of control points.
"We randomly split them into training and testing sets, and the purpose of the training set was solely to optimize the localization of the control points in the second B-spline," Summers said. "Colonoscope localization is only accurate to about 5 cm because there are marks every 10 cm on the scope -- so it's not the most accurate coordinate system," he added.
Nevertheless, the results clearly demonstrated the superiority of the B-spline method for predicting polyp location.
The prediction errors -- differences between the reference and predicted polyp locations at optical colonoscopy -- were 0.9 ± 8.3 cm for prone and 1.9 ± 8.6 cm for supine scans, respectively, for B-spline, compared with 3.0 ± 9.9 cm for NDACC (p < 0.05).
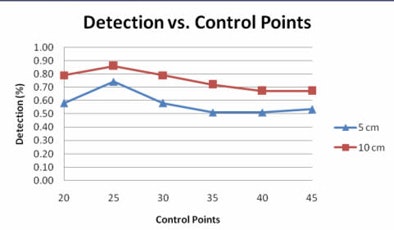 |
| Graph compares the percentage of polyps for various degrees of prediction error at different numbers of control points at 5 cm (blue) and 10 cm (red) error. Of note, 25 prediction points for the second B-spline is associated with the largest number of polyps that can be accurately predicted to within 5 or 10 cm of their true location. All images courtesy of Ron Summers, MD, PhD. |
Moreover, most prediction errors held within 5 cm using the B-spline method, and the percentage of prediction errors within 5 cm was higher for the B-spline curve-fitting method (56.9%) versus the NDACC method (28.7%) (p < 0.05). Predictions that held within 10 cm of the location were 78.7% for B-spline, compared with 78.3% for NDACC (p = 0.68).
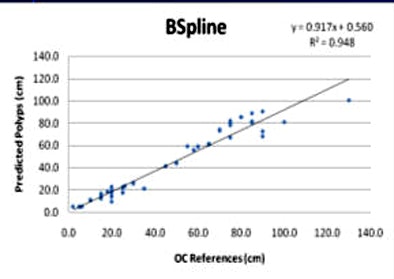 |
| Linear regression curves compare the B-spline (above) and NDACC (below) methods. Of note, the correlation coefficients for the two methods are nearly identical in the training set; Bland-Altman shows the limits of agreement at 25% between the two techniques. However, the polyp locations are more tightly clustered around the red line in the B-spline method compared to NDACC, indicating that about twice as many polyps have prediction errors within 5 cm of their true location in B-spline versus NDACC. |
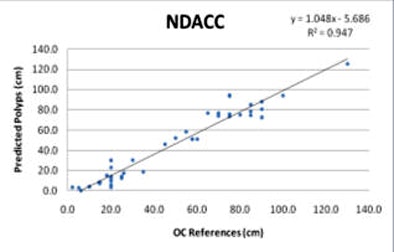 |
The B-spline method's superiority was even more pronounced for the 155 polyps in the center of the colon, where the percentage of prediction errors within 5 cm was 56.9% for B-spline and 28.7% for NDACC (p = 0.68), Summers reported. Prediction errors within 10 cm were 81.9% for B-spline, compared with 71% for NDACC (p = 0.44).
 |
| In the training datasets, the B-spline method found more polyps with a lower location error. |
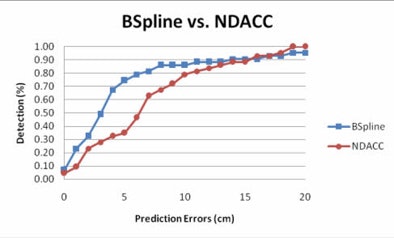 |
"The anatomy of the colon is such that proximal and distal, or retroperitoneal, parts of the colon are relatively fixed, and the central, or intraperitoneal, parts of the colon are more floppy in their position, less rigidly fixed, and more stretchy," Summers explained. "So errors for polyps in that region can be greater, and that's where this [B-spline] method really shines because the polyp prediction location error was within 5 cm for about four times as many polyps with B-spline compared to NDACC."
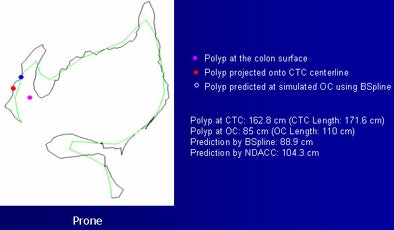 |
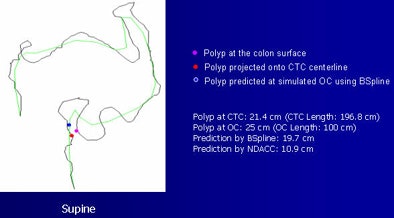
| Examples of the method show a red dot, indicating a polyp, projected onto the CTC centerline. The blue dot represents the simulated location and the purple dot shows the polyp surface. The B-spline method provided greater accuracy. |
 |
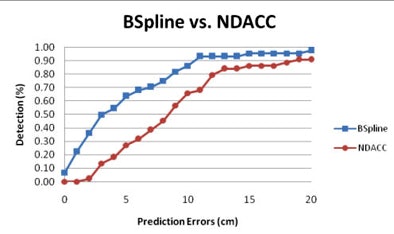 |
| Testing datasets again show the superiority of the B-spline method for predicting polyp location. |
Simulating the endoscope path using B-spline fitting of the centerline from CTC has a higher precision and a lower standard deviation for predicting polyp locations at optical colonoscopy than the NDACC approach, making it a good potential tool for predicting the location of CTC-detected polyps, Summers said.
"It's a relatively straightforward method that gives reduced prediction errors compared to the NDACC method, and because of its simplicity, I think it can be easily incorporated into optical colonoscopy practice to improve the ability of clinicians to find the polyps."
In response to a question from the CARS audience, Summers said there are times when gastroenterologists don't find the polyps they're looking for immediately.
"The gastroenterologists seem to think it's not a problem finding these polyps, but when you see how much they hunt around for the polyps and how much time they spend searching for the polyps, they may not appreciate how much time is spent, and the patient is sedated during this time," Summers said.
By Eric Barnes
AuntMinnie.com staff writer
September 17, 2010
Related Reading
Requiring prone and supine CAD marks boosts VC results, July 14, 2010
VC CAD: Projection-based features reduce false positives, March 10, 2010
VC screening effective in Medicare-age screening cohort, January 27, 2010
Automated QCT offers hope for passive osteoporosis screening, December 28, 2009
VC CAD nabs undetected polyps in jumbo screening study, October 29, 2009
Copyright © 2010 AuntMinnie.com
