A new breast ultrasound computer-aided detection (CAD) application uses a fuzzy 3D image processing scheme to deliver high sensitivity to improve the detection of early breast cancers. Researchers from Taiwan and Korea have developed a reliable system that detects breast tumors in whole-breast ultrasound images.
Ultrasound has become an important complementary modality for early breast cancer detection, but image interpretation remains time-consuming and highly operator-dependent.
"Ultrasound is cross-sectional images, not projection images like mammography," said Ruey-Feng Chang, Ph.D., from the Graduate Institute of Biomedical Electronics and Bioinformatics at National Taiwan University in Taipei. "Ultrasound does not fully cover the breast [at] only 4 cm wide, so the physician needs a lot of examination time to perform breast screening."
Chang's university colleagues in the study were Tzu-Hsuan Chen and Yi-Wei Shen. Dr. Chiun-Sheng Huang from National Taiwan University Hospital in Taipei and Dr. Woo Kyung Moon from Seoul National University Hospital in South Korea were also instrumental in the project, Chang said.
Recently, both Aloka of Tokyo and U-Systems of San Jose, CA, have developed automated whole-breast ultrasound systems to speed breast exams. But because so many images are acquired in whole-breast imaging, interpretation is still very time-consuming, Chang said in a presentation at the 2009 Computer Assisted Radiology and Surgery (CARS) meeting in Berlin. The 3D fuzzy technique was designed to make the process easier by finding suspicious tumor regions for whole-breast ultrasound, Chang said.
Whole-breast US systems
To test the CAD algorithm, Chang and colleagues examined its performance on 45 breast ultrasound cases acquired with U-Systems' SomoVu scanner. The system scans the entire breast with a 14.5-cm probe containing 768 elements, providing a minimum slice thickness of 0.2 mm. However, slice spacing is generally set at 0.6 mm to reduce image file sizes, Chang said.
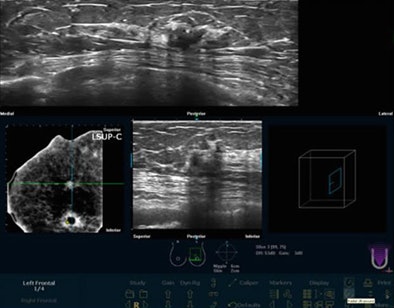
Resolution in A view (y-axis) is 76 pixels/cm, resolution in B view (x-axis) is 35 pixels/cm, and resolution in C view (z-axis) is 16 pixels/cm. C view represents a computer reconstruction of the images, so resolution is lower than in A view.
 |
| Image data are acquired on the SomoVu ScanStation in three planes at different resolutions within the scan space. Resolution in A view (y-axis) is 76 pixels/cm. Resolution in B view (x-axis) is 35 pixels/cm. Resolution in C view (z-axis) is 16 pixels/cm. C view represents a computer reconstruction of the images, so resolution is lower than in A view. Below, whole-breast scan before application of CAD. All images courtesy of Ruey-Feng Chang, Ph.D. |
 |
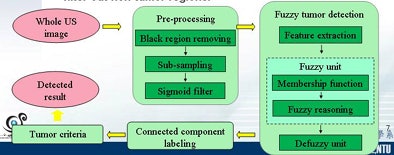 |
| In the CAD scheme, images are preprocessed and a 3D fuzzy technique is used to detect tumor regions in the breast. The connected component labeling groups each voxel of tumor regions, and tumor criteria are proposed to filter out nontumor regions. |
"Images are preprocessed by removing black regions, subsampling to reduce the detection time, and sigmoid filtering to enhance the boundary between tumor and normal tissue," Chang said. "A 3D fuzzy technique is adopted to detect tumor regions in the breast."
 |
| Images are preprocessed by removing black regions, subsampling to reduce detection time, and sigmoid filtering to enhance the boundary between tumor and normal tissue. |
Each voxel is classified into one of three categories: tumor, boundary, and normal tissue, according to the intensity and edge information of the image, Chang explained. Regions classified as tumor are not all tumors, he added. Some are darker regions representing acoustic shadowing or nipple regions.
The voxels are classified individually, Chang said, and then processed using several tumor criteria to help distinguish nontumor regions from suspicious tumor regions obtained by fuzzy tumor detection. The five tumor criteria are:
- Tumor size
- Mean value
- Long-short ratio
- Volume ratio
- Standard deviation
Two features, known as "mean" and "stick," are then extracted and used to construct the membership function for fuzzy reasoning. "Fuzzy reasoning is adopted to decide the category of each voxel," Chang said. "Finally, the relaxation method is used to defuzz and determine tumor regions."
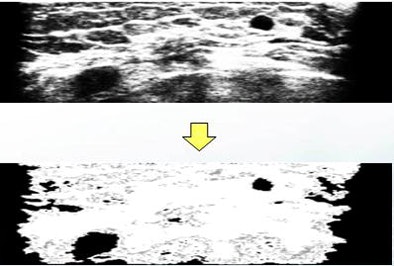
The results of fuzzy reasoning show tumor regions in black, boundary regions in gray, and normal tissue in white.
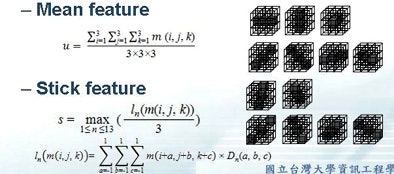 |
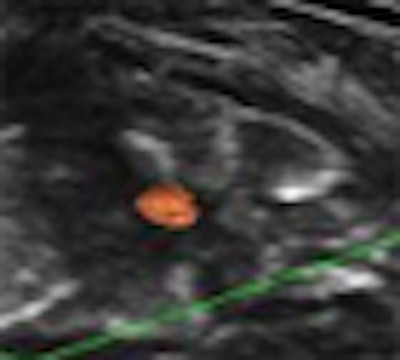
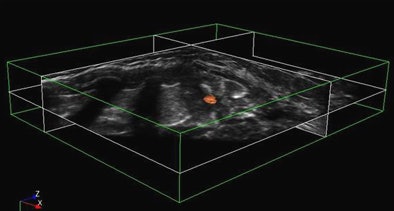
| Two kinds of feature parameters, identified as "mean" and "stick," are extracted to generate the membership function for fuzzy reasoning. Below, the initial results of fuzzy tumor detection show tumor regions in black, boundary regions in gray, and normal tissue in white. Next, graphical user interface demonstrates final CAD results after application of five tumor criteria (size, mean value, long-short ratio, volume ratio, standard deviation) to filter out nontumors. Bottom image shows final view of CAD-detected tumor in orange. |
 |
 |
Among the 45 datasets, 64 lesions (28 benign and 36 malignant) were identified. The experimental CAD scheme's accuracy for tumor detection was 78.60% for benign lesions and 91.70% for malignant tumors.
"The sensitivity is up to 85.9% [55/64] with a 1.71 false-positive rate per case," Chang said. "We can check each slice in about two to three minutes."
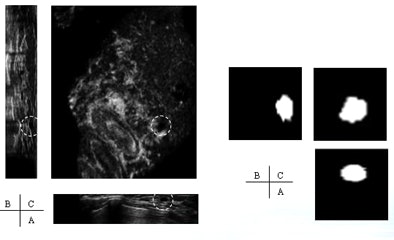 |
| True-positive case shows tumor detected in all three views. |
"Some of the benign tumors are too small and will be missed," he said, whereas fewer than 10% of the malignant cases were missed by CAD. One false negative resulted from too small a distance between the tumor and a dark region, leading to the tumor being categorized as an acoustic shadow region by the CAD. The group will continue to refine the application, Chang said.
"The 3D fuzzy tumor detection method could be combined with 3D tumor criteria to delete suspicious tumor regions and decrease false positives," Chang said.
"In order to detect the tumor regions which are close to darker regions such as shadow or nipple, 2D and 3D methods may be combined to detect the regions," he said. "Because most [> 95%] of tumors are located inside or near the mammary gland, gland/fat analysis might be helpful ... so we can do a better analysis and improve the performance."
An audience member at the presentation suggested that handheld rather than automated ultrasound might hold an advantage for CAD functionality because the probe can be repositioned manually to eliminate acoustic shadowing of normal structures.
By Eric Barnes
AuntMinnie.com staff writer
September 3, 2009
Related Reading
Breast US image analysis helps predict metastasis, July 29, 2009
Breast ultrasound CAD performance varies in ethnic populations, September 5, 2008
CARS report: CAD prompts range of behaviors in readers, June 26, 2008
Breast CAD improves classification accuracy, cuts ultrasound biopsies, February 29, 2008
Breast MRI CAD doesn't improve accuracy due to poor DCIS detection, February 18, 2008
Copyright © 2009 AuntMinnie.com

