The development of automated perfusion-mapping software for CT data has opened up intriguing possibilities for the assessment of tumor vascularity, specifically for monitoring response to antiangiogenic drug treatment.
In colon cancer staging with CT, for example, parametric mapping software makes it possible to evaluate the effectiveness of the first antiangiogenic drug to be approved for clinical use, bevacizumab (Avastin, Genentech, South San Francisco, CA). Any reduction in tumor vascularity over time would presumably show up on such a map.
But where, precisely, to measure tumor vascularity is a question that had not been addressed previously, wrote study authors Vicky Goh, Dr. Steve Halligan, and colleagues from University College Hospital in London, St. Mark's Hospital in Harrow, and the University of Hertfordshire in Hatfield, all in the U.K.
"Although commercial software has enabled evaluation of tumor vascular parameters, such as blood flow, blood volume, and permeability-surface area product following drug therapy, how the measurements should be made is a topic of debate," they wrote. "In particular, it is unclear whether analysis should include the entire tumor volume or a representative tumor section and whether the representative tumor section is sufficient to reflect therapeutic effect accurately" (Radiology, June 2008, Vol. 247:3, pp. 726-732).
Central to the quantitative assessment of perfusion is defining the tumor region of interest (ROI), they wrote. "It is well recognized that tumor perfusion is spatially heterogeneous, yet, to date, there has been no systematic evaluation as to what extent the size and position of the tumor ROI influence ultimate values."
The study examined 47 patients (25 men, 22 women; mean age, 65.8 years; range, 28.1-88.7 years) presenting for the pretreatment staging of colorectal cancer. In all there were 19 tumors in the rectum, nine in the cecum, three in the ascending colon, one in the transverse colon, one in the descending colon, and 14 in the sigmoid colon. The tumors had a mean length of 5.4 cm (range, 2.0-13.3 cm) and a mean depth of 4.6 cm (range, 2.0-8.0 cm) on contrast-enhanced CT.
The patients fasted for four hours. A noncontrast abdominopelvic study was acquired first to localize the known colorectal tumors.
Then, 30 minutes before contrast-enhanced scans, the patients ingested 1,000 mL of water-soluble contrast with a concentration of 2% to 4% meglumine and sodium diatrizoate (Gastrografin, Bracco, Milan, Italy). Patients were also given 20 mg hyoscine butylbromide (Buscopan, Boehringer Ingelheim, Ingelheim, Germany) as a spasmolytic. An abdominal band restraint was used to minimize abdominal wall motion.
All images were acquired using a four-detector-row scanner (LightSpeed Plus, GE Healthcare, Chalfont St. Giles, U.K.). The scan coordinates from the abdominal pelvic study were used to plan the subsequent dynamic study.
For this scan, a pump injector (PercuPump Touchscreen, Bracco) was used to inject 100 mL of iopamidol 340 (Niopam 340, Bracco). The images were acquired in cine mode using 120 kV, 60 mA, and a 512 x 512-mm matrix, at an effective dose of 10 mSv.
Then, 75 seconds after the contrast injection, dynamic portal-venous phase images were acquired to determine the local and distant stage of the tumor, at 120 kV, 280 mA, and a 512 x 512-mm matrix.
After the images were transferred to a workstation (Advantage Windows 4.2, GE), they were evaluated by a single experienced abdominal radiologist using CT perfusion software (Body protocol, Perfusion 3.0, GE).
The researchers measured blood volume, blood flow, and permeability-surface area product for 40- or 120-mm2 circular ROIs placed at the tumor edge and center and around the manually outlined visible tumor, the authors wrote. The ROI analysis was repeated by two observers in different subsets of patients to assess intra- and interobserver variation.
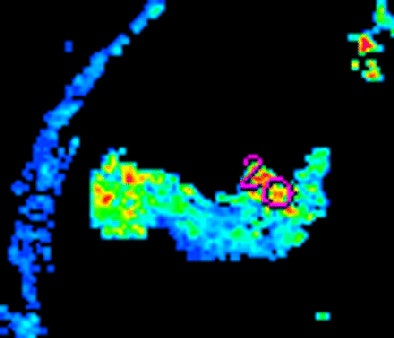
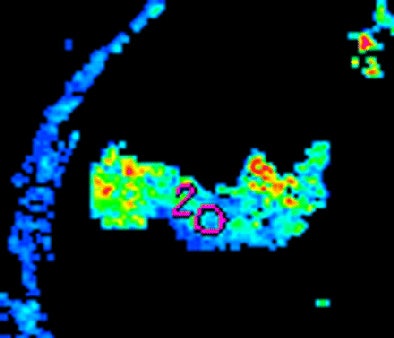
The position and size of the ROI had a major impact on measurements, the team reported. All three measures -- blood volume, blood flow, and permeability-surface area product -- were significantly higher at the tumor edge versus the center in both 40- and 120-mm2 ROIs (p < 0.001).
Variation in tumor perfusion vascularity measurement, in grams per minute
|
||||||||||||||||
| SD = standard deviation |
Thus, the measurements varied substantially depending on the size of the ROI. Region-of-interest values for the outlined tumor as a whole fell between those at the center and those at the edge. Both inter- and intraobserver agreement was poor for both 40- and 120-mm2 ROIs, the authors wrote. The results were in line with what is known about tumor perfusion.
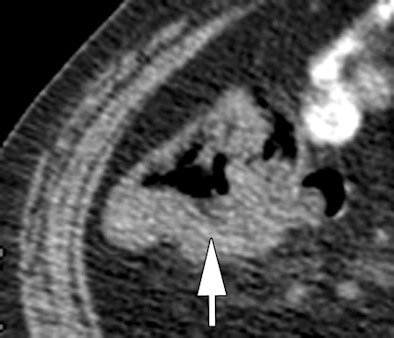 |
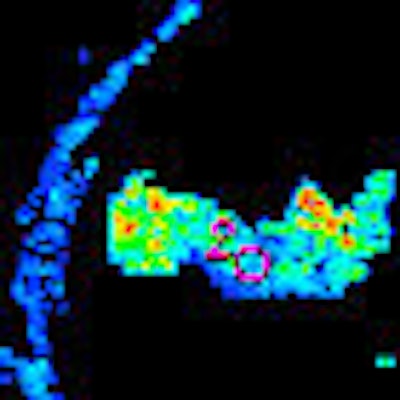
| Morphologic image (arrow, above) shows cecal cancer. Corresponding blood volume parametric maps show 40-mm2 ROI at tumor edge (below) and center (bottom). Images republished with permission of the Radiological Society of North America. Goh V, Halligan S, Gharpuray A, Wellsted D, Sundin J, Bartram CI. Quantitative assessment of colorectal cancer tumor vascular parameters by using perfusion CT: Influence of tumor region of interest. Radiology. 2008;247(3):726-732. |
 |
 |
"These findings are concordant with morphologic data that have considered the distribution of vessels in colorectal cancers," they wrote. "For example, findings in a study of the three-dimensional vascular structure of colorectal tumors assessed by using microvessel corrosion casting and electron scanning micrography indicated elegantly that tumor vessels demonstrate a zonal distribution irrespective of tumor size. Vascularity decreased from the tumor edge to the center, with the tumor center poorly vascularized. Vessels in the tumor center also appeared compressed and elongated when they were compared with vessels (which were dilated) in areas of greater vessel density."
Position and size of tumor ROI and observer variation substantially influence ultimate perfusion values. While the study data suggest that tumor measurements should be obtained from the edge, the center, and the entire volume, this approach would be time-consuming, Goh and colleagues stated. Inasmuch as the data also show that ROI placement is arbitrary, such an approach could add significant variability to the results.
"Although an ROI outlining the tumor may not best reflect the spatial distribution of the tumor vasculature, outlining of the tumor may remain the most appropriate method for analysis," they concluded. In addition, pending the establishment of standardized practices, the type of ROI analysis used should be specified.
By Eric Barnes
AuntMinnie.com staff writer
August 26, 2008
Related Reading
Perfusion MRI can predict progression of gliomas, April 30, 2008
MR perfusion imaging predicts malignant transformation of gliomas, March 27, 2008
Dual-source CT edges into cardiac SPECT turf, March 6, 2008
Study tests low dose ranges for perfusion CT, December 10, 2007
Distinct CT perfusion parameters help assess HCC, November 29, 2005
Copyright © 2008 AuntMinnie.com


