Patient surveys indicate that the biggest barrier to colon cancer screening in the U.S. is the laxative bowel prep, used for conventional as well as virtual colonoscopy (VC or CT colonography). Patients find cathartic bowel preparations uncomfortable, time-consuming, and embarrassing, so it's no wonder they are a factor in the low compliance rate, with as many as 60% of individuals over 50 never getting screened for colorectal cancer.
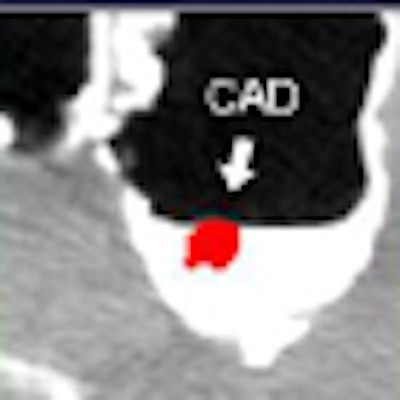
Unlike conventional colonoscopy, virtual colonoscopy can be performed without cathartic cleansing, and a few studies have shown comparable results to data from cleansed colons. But it's also clear that tagged, unprepped data are more difficult to interpret for both radiologists as well as computer-aided detection (CAD) systems that detect polyps automatically from CT data.
Aiming to optimize the results of prepless VC, researchers from Harvard Medical School and Massachusetts General Hospital in Boston and Stedelijk Ziekenhuis in Roeselare, Belgium, developed a pair of tools to process unprepped CT data and make it easier to read. According to the results of a pilot study performed on 30 clinical cases, the methods reduced false positives by as much as one-third.
"Laxative-free [CT colonography (CTC)] would be comfortable for patients, but it complicates the interpretation of CTC data in various ways, and at the moment effective tools are missing," said Janne Näppi, Ph.D., from Harvard Medical School and Massachusetts General Hospital. "In this study we are attempting to advance laxative-free CTC by developing methods for excluding residual feces on CTC data, especially for CAD."
A principal problem with unprepped CTC data is that untagged feces often mimic the shape and radiodensity of true polyps, Näppi said.
 |
| Laxative-free virtual colonoscopy is more comfortable for the patient but harder on the radiologist, complicating interpretation in many ways. All images and data courtesy of Dr. Janne Näppi, Ph.D. |
"Polypoid residual feces are greatly affected by partial-volume enhancement, so that the tagging in reconstructed images is 'diluted' by the air component in tagged feces," he said. Such "dilution" can be trying when the density of the residual stool is the same density as a polyp, he said, and even worse when it is shaped like a polyp. Näppi presented the results at the 2008 Computer Assisted Radiology and Surgery (CARS) meeting in Barcelona, Spain. His coinvestigators were Dr. Hiro Yoshida, Dr. Philippe Lefere, and Dr. Stefaan Gryspeerdt.
Partial-volume enhancement makes partially tagged regions hard to read, Näppi said. If the normal density of tagged feces were 500 HU, and the normal density of the air component inside the stool were -1,000 HU, for example, partial-volume effect would effectively average the two regions and display the area at 125 HU -- roughly the same density as a true polyp and therefore not helpful when looking for stool.
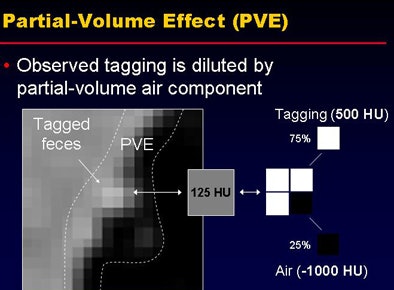 |
| Partial-volume effect dilutes the CT values of tagged feces, because the very high attenuation of tagged regions is offset by the low and often inhomogenous internal attenuation of fecal residues. The resulting attenuation values are similar to the soft-tissue values of colorectal polyps, making it difficult to distinguish tagged or partially tagged residual fecal material. |
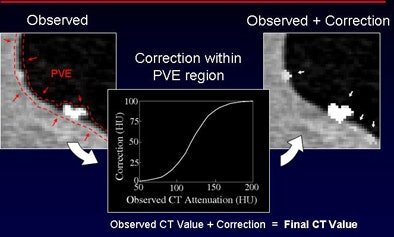
In an effort to make tagged stool more readily identifiable by CAD, the investigators developed a densitometric partial-volume enhancement method to identify regions of partial-volume enhancement and correct CT values at the interface. "For values that are higher than 50 HU, we add the correction to the [gradient] magnitude so the attenuation gets higher, and polypoid feces are now enhanced within this CTC data," he said. "The idea is to subtract the pseudoenhancement effect from this data."
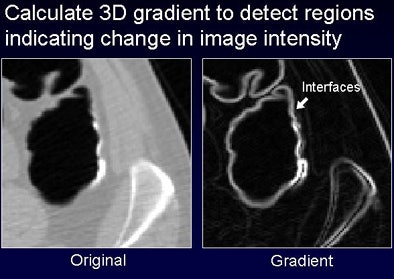
The steps to partial-volume enhancement include correction of pseudoenhancement by correcting partial-volume material fractions and identification of partial-volume enhancement interfaces by calculating the gradient magnitude of the CT value (regions with high gradients indicate material interfaces). Finally, CT values that exceed a threshold are elevated according to a mapping function, "enhancing the partial-volume values that appear at this interface," Näppi explained.
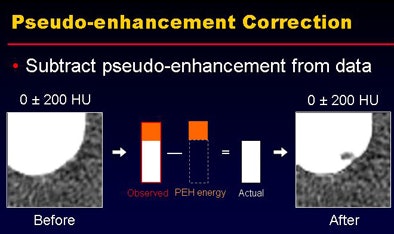 |
| Densitometric partial-volume correction is designed to correct the low attenuation of tagged feces that occurs due to the partial-volume effect that incorporates the low-attenuating regions of fecal residue into the CT values. The process consists of three steps: pseudoenhancement is subtracted from the CTC data (top), partial-volume interfaces are identified by calculating the 3D gradient to detect regions that indicate changes in image intensity, and adaptive enhancement is used to correct attenuation within the partial-volume region. |
 |
 |
Connection analysis
Unfortunately, partial-volume enhancement alone won't identify all fecal residue regardless of the duration of tagging or the method used. Some residue will remain untagged or only partially tagged. Distinguishing partially tagged feces isn't a major problem for residues with an inhomogenous internal density pattern. "They can be readily identified with texture feature analysis by a classifier," Näppi said. But other untagged or partially tagged residues mimic the shape and internal density of polypoid lesions.
Fortunately, there is another way to find them. "We noticed that some of these [feces] do not adhere to colonic wall," Näppi said. Findings that have no direct connection to the wall can be dismissed as fecal residue. The researchers developed a wall-connection analysis method to distinguish these unmoored findings. This method could be problematic in cases where untagged feces appear at the surface of tagged materials, because the residues tend to be connected artificially to the wall due to partial-volume surface voxels with CT values in the soft-tissue range. To compensate, the wall-connection analysis method excludes surface values with a high gradient magnitude before the connectedness components are determined, Näppi said.
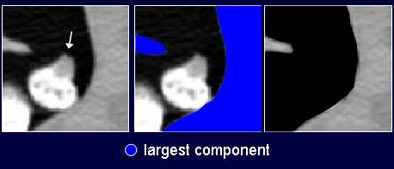 |
| The second method of distinguishing fecal residue, wall-connection analysis, finds the largest "connected" component of the CT data by clipping CT values in the soft-tissue range. This helps reduce false-positive CAD detections by ensuring that all polyp candidates are connected to the colon wall. |
"To evaluate these methods we considered laxative-free CTC and assessed CAD performance in a pilot study of 30 patients," he said. In lieu of cathartic bowel cleansing, the subjects (age range, 38-82 years) drank small amounts (50-250 mL) of an apple-flavored barium suspension with meals for one or two days prior to VC performed on one of two scanners using collimation ranging from 1 to 2.5 mm at 28-84 mAs, 100-120 kVp. Reconstruction intervals ranged from 0.7 to 1.3 mm. Images were acquired at 28-84 mAs and 120-140 kVp. All findings were confirmed with optical colonoscopy performed within a week of VC.
Results from the group's previously developed CAD scheme were examined with and without the two enhancement methods used in the study to compare estimated detection accuracy and false-positive rate, Näppi said.
Results in the 30 datasets, confirmed by colonoscopy, yielded three polyps 10 mm or larger in two patients and five polyps 6-9 mm in diameter in two other patients. All of the polyps were either covered by or touching tagged materials.
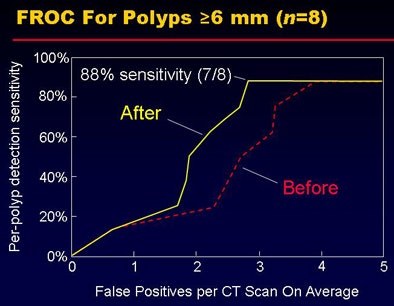
Per-lesion detection accuracy with (and without) the proposed methods was 100%, with 2.8 (3.3) false-positive detections per CT scan for polyps 10 mm or larger and 2.7 (3.9) false-positive detections for lesions 6-9 mm. Among the five 6-9-mm lesions, one polyp was missed by CAD, yielding 88% sensitivity. False positives were reduced by 15% for lesions 10 mm and larger and by 31% for lesions 6-9 mm.
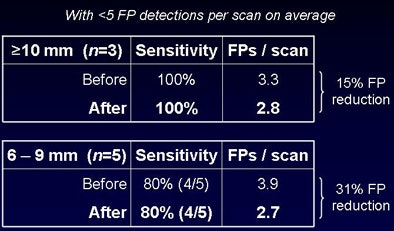 |
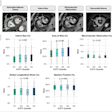
| In a pilot study of 30 clinical cases, the number of false positives was reduced after application of the two methods (top). The fROC curve results show the reduction of false positives in 6-9-mm polyps. |
 |
Among the false positives identified by the densitometric partial-volume enhancement method and the wall-connection analysis method, approximately 41% were caused by poorly tagged feces, with 30% caused by completely untagged feces. Most of the remaining false positives were caused by fecal residues that adhered to the bowel wall.
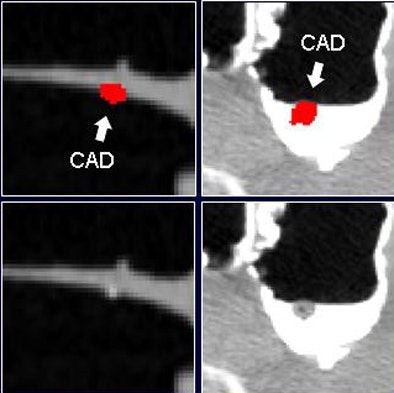 |
| Before the application of the densitometric partial-volume correction and wall-connection analysis (top row) in virtual colonoscopy data, CAD misinterprets residual fecal material as polyps. These false positives are eliminated after application of the two methods (bottom row). |
"We developed two methods for enhancement and identification of polyplike structures, and also wall-connectedness analysis for the identification of completely untagged feces for laxative-free CTC," Näppi said. "This pilot study indicates that the application of these methods can reduce false positives up to 30%, and these methods may be particularly effective for smaller 6 to 9-mm polyps."
In response to a question from the audience, Näppi said that the presence of a thin coating of tagging material on a true polyp does not appear to prevent detection by CAD, perhaps because the internal soft-tissue densities are correctly read as polyps.
By Eric Barnes
AuntMinie.com staff writer
August 4, 2008
Related Reading
Higher VC laxative dose burdens patients, doesn't improve reads, July 16, 2008
New low-volume bowel cleansing solution effective, more acceptable, May 9, 2008
VC CAD finds polyps in prepped or unprepped patients, May 6, 2008
Minimal-prep VC may miss more flat lesions, April 17, 2008
Bowel prep with sodium phosphate or PEG pose low risks of renal impairment, January 4, 2008
Copyright © 2008 AuntMinnie.com


