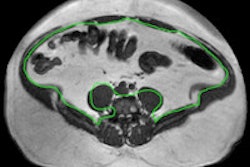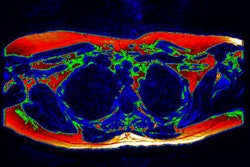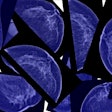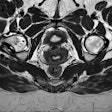
VIENNA - MRI and spectroscopy can accurately measure fat volumes in bariatric patients before and after surgery, according to the results of a German study presented at ECR 2017 on Saturday.
Fat quantification with MRI is well-established for the quantification of adipose tissue, but there is little evidence to demonstrate its accuracy or indicate the best way to measure it in vitro. Researchers from Leipzig University Hospital's Obesity Center used a phantom technique to test the accuracy of their MR fat assessments in patients undergoing bariatric surgery.
 Dr. Nicolas Linder from Leipzig University Hospital.
Loading up phantoms with two separate sets of fat emulsions with fat concentrations ranging from 10% to 100%, they tested the method with MRI and point-resolved spectroscopy (PRESS). The group found correlation nearing 100% with the Dixon and PRESS MRI sequences used on other scanners.
"For both the Dixon and the PRESS technique, there is quite a nice fit with the numbers from the literature ... and we have a good feeling about using these techniques in clinical practice," said Dr. Nicolas Linder from the Obesity Center.
The use of bariatric surgery has exploded in recent years, in no small measure because it often succeeds where other weight-loss methods fail, reducing the risk of death and serious disease in the morbidly obese. Physicians in Leipzig assess the lipid content of patients before and after surgery to restrict the volume of the stomach and remove fat. A typical patient might go into surgery with 20 L of measured fat and come out with 6 L, Linder told AuntMinnie.com. The difficult part has been accurately quantifying fat volumes to optimize patient management, he said.
"We wondered how exact our MR methods were" compared with studies in recent years evaluating the accuracy of various MR techniques versus the gold standard of MR spectroscopy, known as the PRESS sequence, Linder said. Most studies have been performed on GE Healthcare 3-tesla machines, but results on the center's 1.5-tesla Philips Healthcare scanner would help validate the accuracy of the center's daily work.
The group ordered two fat phantoms from different pharmaceutical laboratories, which provided two sets of fat emulsions (E1 and E2). Fat concentrations ranged from zero, representing pure water, to 100%, in steps of 10%, the group wrote in an abstract.
The large range of samples was due to the lack of existing information, inasmuch as "somehow nobody in the literature seems to know what is the perfect way to construct an in-vitro fat sample," Linder said.
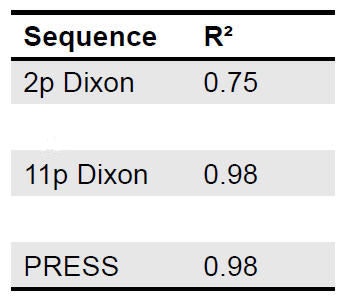 Correlation was acceptable for all MRI sequences, particularly the 11-point Dixon, which was an excellent fit. All data points were within the 95% limits of agreement. Images courtesy of Dr. Nicolas Linder.
MRI with four total sequences was performed on a 1.5-tesla scanner (Achieva, Philips), including two Dixon sequences that were designed to achieve uniform fat suppression:
- 2-point Dixon: slice thickness of 10 mm, field-of-view of 530 x 530 mm, echo time (TE) 1 of 3.45 msec, delta TE of 1.44 msec
- 11-point Dixon: slice thickness of 10 mm, field-of-view of 530 x 530 mm, TE1 of 3.45 msec, delta TE of 1.44 msec
Proton spectroscopy sequences included stimulated-echo acquisition mode (STEAM) (volume of interest = 20 x 20 x 20 mm, TE = 10 msec, repetition time = 4,000 msec) and PRESS (volume of interest = 30 x 30 x 30 mm, TE = 29 msec, repetition time = 3,500 msec).
The overall performance of the three MR techniques was moderate to good, with the best results shown in the 11-point Dixon technique.
 Bland-Altman plots comparing MR measurements and reference: Lipid content as measured by (a, left) PRESS and (b, right) 11-point Dixon was correlated to the reference and resulting difference and averages are plotted. Dotted lines indicate 95% confidence intervals.
Linder said the sequences would be used to optimize the MR protocols in the clinic.

