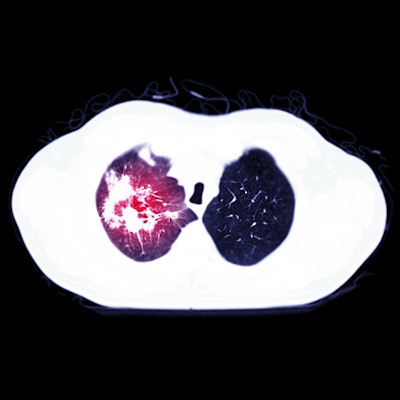
Pulmonary embolism occurs most often in COVID-19 patients in the intensive care unit (ICU), followed by those treated on general wards and the emergency room (ER), Dutch authors have reported.
Also, pulmonary embolism in COVID-19 cases is more commonly located in peripheral rather than central pulmonary arteries, which suggests local thrombosis plays a major role. Additionally, D-dimer assessment may help to select patients with COVID-19 for CT pulmonary angiography, using D-dimer cutoff levels of at least 1,000 µg/L, according to the study posted on 9 May by European Radiology.
Dr. Robert M. Kwee, PhD, a radiologist at Zuyderland Medical Center in Heerlen/Sittard/Geleen, and colleagues set out to investigate in a meta-analysis the frequency of pulmonary embolism in patients with COVID-19 and whether D-dimer assessment may be useful to select patients for CTPA.
They carried out a systematic literature search for original studies that reported the frequency of pulmonary embolism on CTPA in patients with COVID-19. The frequency of pulmonary embolism, the location of pulmonary embolism, and the standardized mean difference (SMD) of D-dimer levels between patients with and without pulmonary embolism were pooled by random-effects models.
The authors evaluated 71 studies, and their main findings were the following:
- Pooled frequencies of pulmonary embolism in patients with COVID-19 at the ER, general wards, and ICU were 17.9% (95% confidence interval [CI]: 12%-23.8%), 23.9% (95% CI: 15.2%-32.7%), and 48.6% (95% CI: 41%-56.1%), respectively.
- Pulmonary embolism was more commonly located in peripheral than in main pulmonary arteries (pooled frequency of 65.3% [95% CI: 60%-70.1%] vs. 32.9% [95% CI: 26.7%-39%]; odds ratio = 3.54 [95% CI: 2.3%-5.4%]).
- Patients with pulmonary embolism had significantly higher D-dimer levels (pooled standardized mean difference of 1.096 [95% CI, 0.844-1.349]). D-dimer cutoff levels used to identify patients with pulmonary embolism varied between 1,000 and 4,800 µg/L.
The study has some limitations, the authors conceded. First, in the vast majority of included studies, CTPA was only performed in case of clinically suspected pulmonary embolism. Therefore, the true prevalence of pulmonary embolism in patients with COVID-19 remains unclear.
Second, due to incomplete and unstandardized reporting, the authors could not adjust the frequency of pulmonary embolism for well-known risk factors -- such as cancer, history of previous venous thromboembolism, duration of hospitalization, obesity, and cardiovascular disease -- and type and dosage of antithrombotic prophylaxis. Third, there was a great deal of heterogeneity in the patient population and the indication for CTPA in each included study.
"Although we attempted to group the studies into ER, general wards, and ICU patients, this delineation may be problematic due to the unpredictable course of COVID-19 and the fact that a patient discharged from the ER could become an ICU acute respiratory distress syndrome patient within a matter of a week. Furthermore, statistical heterogeneity still remained in each of these groups," they stated.
In addition, CTPA has a good but not perfect sensitivity in pulmonary embolism detection. Smaller subsegmental pulmonary embolisms may be clinically less relevant, but they might have been missed by CTPA, and this could have resulted in an underestimation of pulmonary embolism frequency, according to Kwee and colleagues.
Results from a German study
In another new article about pulmonary embolism posted by the European Journal of Radiology on 7 May, German researchers found that the temporal distribution of demand for CTPA depends on the sector of patient care and the processing time differs substantially during the day. Time series analysis can reveal such coherences and may help to optimize workflows in radiology departments.
Dr. Daniel Koehler, a radiologist at University Medical Center Hamburg-Eppendorf, Hamburg, and colleagues identified time data from physical examination to report creation for each CTPA in 2013 and 2018. They used multivariable, multinomial logistic and linear regression models to evaluate differences between three time intervals: 6 a.m. to 2 p.m., 2 p.m. to 10 p.m., and 10 p.m. to 6 a.m.
"Requests during night hours were generally handled quicker than during daytime, even in fatal cases," they noted. "Time series analysis of routinely created time data ... may be a potential tool in the fields of resource planning and quality control in radiology departments without the need for large investments."


