Combining FDG-PET/CT and diffusion-weighed MRI (DWI-MRI) may be useful for predicting the histologic response of osteosarcoma to neoadjuvant chemotherapy, according to a study published in the July issue of the Journal of Nuclear Medicine.
Korean researchers analyzed changes in standardized uptake values (SUV) from FDG-PET/CT and apparent diffusion coefficient (ADC) values from DWI-MRI and found a negative correlation between the imaging parameters, which were both effective in predicting tumor response after therapy.
According to the authors, this study was the first to measure both the SUV change and ADC change in patients with osteosarcoma after completion of neoadjuvant chemotherapy using sequential FDG-PET/CT and MRI.
The study was led by Dr. Byung Hyun Byun from the department of nuclear medicine at the Korea Institute of Radiological and Medical Sciences in Seoul (JNM, July 2013, Vol. 54:7, pp. 1053-1059).
Improved survival rates
As previous studies have shown, adjuvant and neoadjuvant chemotherapy can greatly improve long-term survival for patients with high-grade osteosarcoma compared to surgery alone, according to the authors. The standard method to assess the efficacy of chemotherapy is to remove and evaluate tumor specimens for necrosis.
However, because tumor necrosis can be evaluated only in resected specimens after neoadjuvant chemotherapy, the continuation of ineffective chemotherapy can cause the development of therapy-resistant tumors. Therefore, noninvasive imaging modalities, such as bone scintigraphy, CT, MRI, and FDG-PET, have been explored to better determine how well neoadjuvant chemotherapy is combating a patient's cancer.
With FDG-PET's ability to assess the metabolic activity of cancer tissue and DWI-MRI's detection of altered water diffusion in highly cellular tissue such as malignant tumors, both modalities have been useful in monitoring the therapeutic response of osteosarcoma. In addition, based on recent research, simultaneous or sequential acquisition of PET and MR images with PET/MR systems appears feasible for detecting suspicious lesions.
In the current study, Byun and colleagues sought to assess the potential of sequential FDG-PET/CT and DWI-MRI to monitor the response of patients with osteosarcoma in their extremities who received neoadjuvant chemotherapy.
The researchers prospectively enrolled 27 consecutive patients between May 2010 and March 2012. The mean age of the participants was 20.6 years (± 12.6 years), with 15 male and 12 female subjects.
Fourteen patients (52%) had stage IIA osteosarcoma and four (15%) had distant metastasis at diagnosis. The most frequent location of the primary tumor was the femur (16 patients, 60%), followed by the tibia (nine patients, 33%).
All patients underwent sequential FDG-PET/CT and MRI before and after neoadjuvant chemotherapy, receiving a whole-body PET/CT scan (Biograph 6, Siemens Healthcare) and a whole-body MRI exam on a 3-tesla system (Magnetom Trio, Siemens).
PET/CT images were acquired from the vertex to the upper thigh in five to six bed positions over 60 minutes after injection of FDG. FDG dose was based on 7.4 MBq/kg of body weight for children younger than 15 years; older subjects received 370 MBq of FDG regardless of body weight. Additional PET/CT scans were performed over a patient's lower extremities in six to seven bed positions.
MR images were obtained on the same day as the PET/CT scans using a body-array surface coil and the injection of the contrast agent gadodiamide (Omniscan, GE Healthcare) at a rate of 0.1 mmol/kg. DWI images were acquired using a spin-echo-type single-shot echo-planar imaging (EPI) sequence.
After surgery, Byun and colleagues graded responses to neoadjuvant chemotherapy as III and IV for tumor necrosis of at least 90%, indicating a good response to therapy. Grades I or II were used for tumor necrosis less than 90%, indicating a poor response.
The researchers measured maximum standardized uptake value (SUVmax), tumor volume based on MRI (MRV), and the mean apparent diffusion coefficient pre- and post-treatment. The group then calculated the percentage changes in these parameters, along with correlations among them.
Treatment results
The mean time between the end of neoadjuvant chemotherapy and follow-up PET and MRI scans was 12.8 days, ranging from 11 to 16 days. The mean time between follow-up PET and MRI and surgery was two days.
The resected specimens showed that 12 patients (44%) had a good histologic response after neoadjuvant chemotherapy. The median pretherapy MRV of all 27 osteosarcomas was 94.5 cm3. There was no significant difference in the pretreatment MRV between patients with a good histologic response (median, 49.4 cm3) and those with a poor histologic response (median, 116.9 cm3).
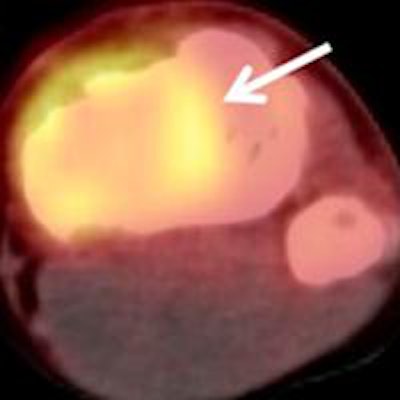
 A 15-year-old male patient with osteosarcoma of the left tibia showed good histologic response after completing neoadjuvant chemotherapy. Although the patient was classified as a poor responder based on SUV change, he was classified as a good responder based on ADC change or the combination of SUV change and ADC change. Baseline transverse PET/CT image (A) shows increased FDG uptake of tumor with SUVmax of 2.9. Postchemotherapy PET/CT image (C) shows residual FDG uptake with SUVmax of 2.0, for an SUV change of -31%. In the baseline ADC map (B), mean ADC of tumor was 1.092 x 10⁻³ mm2/sec. In the postchemotherapy ADC map (D), mean ADC was 1.612 x 10⁻³ mm2/sec, for an ADC change of 47.6%. Images courtesy of JNM.
After the completion of neoadjuvant chemotherapy, all patients had tumors that demonstrated FDG uptake greater than adjacent normal bone. The mean SUVmax of the 27 patients decreased from 9.2 (± 6.0) to 5.4 (± 3.5), while the median ADC value increased from 1.346 × 10⁻³ mm2/sec to 1.612 × 10⁻³ mm2/sec after neoadjuvant chemotherapy.
In a subgroup of patients with a good histologic response, the mean SUVmax decreased from 7.5 (± 3.1) to 3.4 (± 1.4) and the median ADC value increased from 1.276 × 10⁻³ mm2/sec to 1.704 × 10⁻³ mm2/sec after neoadjuvant chemotherapy.
However, there was no significant difference in median MRV before and after treatment in either case.
The change in SUV and the change in ADC "negatively correlated with each other, and both parameters predicted histologic response after neoadjuvant chemotherapy," Byun and colleagues wrote. The combined use of change in SUV and ADC "served to discriminate good histologic responses."
They speculated that the lack of correlation between change in MRV and histologic response could be due to the "relatively small sample size, which can limit the ability to detect significant differences because of reduced statistical power," or other factors.
The authors believe this is the first study to measure both change in SUV and change in ADC of osteosarcoma after the completion of neoadjuvant chemotherapy using sequential FDG-PET/CT and MRI, they wrote.
They cited several limitations of the research, including the lack of a standard method to measure the ADC value of osteosarcoma. However, because of the relatively large sizes of the tumors, the researchers were able to draw regions of interest and calculate ADC values based on a consensus of two study authors.
Both PET/CT and DWI-MRI are useful for predicting histologic response after neoadjuvant chemotherapy in patients with osteosarcoma, Byun and colleagues concluded. Their combined use may be effective for predicting histologic response to neoadjuvant chemotherapy.

