Researchers from Florence, Italy, have developed a robust and accurate method of measuring most lung nodules, improving the odds that growing lesions can be detected at CT with greater accuracy and reproducibility compared to current methods that rely on prior segmentation of the CT data.
There are a few different ways to measure nodule size on CT images, but none are as accurate as is needed for assessing whether a lung nodule has grown over time. Linear measurements of nodules can be taken with electronic calipers, for example. In addition, various algorithms can be employed to assess nodule volumes. A major drawback for determining volumetric estimates of nodule size is that they require initial segmentation of the lung nodule, a complex task that is strongly affected by the connections between nodules and their surroundings, and by the quality of contrast separating the nodule from its surroundings.
Finally, nodule borders are often poorly defined, rendering nodule volume measurements both inaccurate and difficult to reproduce.
"Why are we interested in nodule size? Because nodule growth observed at CT scans acquired at different times is the primary clue for the characterization of malignancy -- either greater than 10 mm or less than 10 mm," said Dr. Stefano Diciotti from the Department of Electronics and Telecommunications at the University of Florence in Italy.
Aiming to improve the accuracy of lung nodule measurement, Diciotti, Simone Lombardo, and colleagues developed a "space-scale approach that avoids the need for prior segmentation process," Diciotti said at the 2008 Computer Assisted Radiology and Surgery (CARS) meeting in Barcelona. "Since lung nodules can be modeled as bright bloblike structures including the lung fields, we [performed] a multiscale characterization of such patterns using Laplacian of Gaussian [LoG] kernels."
Those so-called bloblike structures on CT data include well-circumscribed nodules and juxtavascular nodules, two categories that comprise nearly 80% of all lung nodules, Diciotti said. Unfortunately, juxtapleural nodules, because of their proximity to other anatomic structures, "can't really be considered bloblike entities," and therefore can't be classified by the proposed method, he said. "Our study is a linear space-based analysis for nodule characterization," Diciotti said.
The space-scale classification method is analogous to what happens naturally when objects are viewed, Diciotti said. Space-scale theory is the theory of apertures through which humans and machines view the world. The term "space-scale" refers to the space that is formed by looking at an image at many different scales simultaneously. When those scales are stacked, an additional dimension is created, that of the scale dimension. The space-scale is the space of the spatial and scale dimensions, while multiscale viewing describes the natural process of observation, he said.
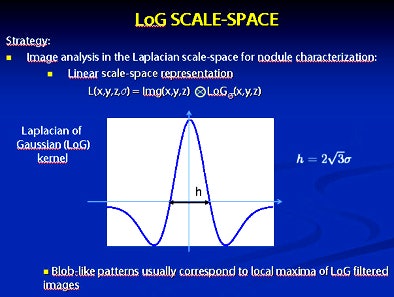 |
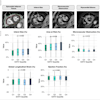
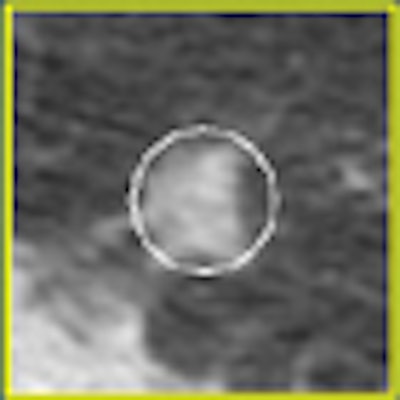
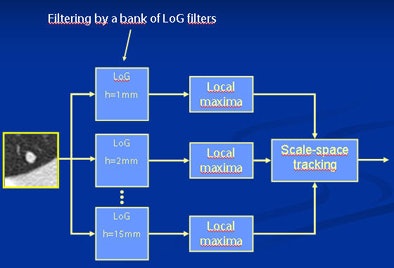
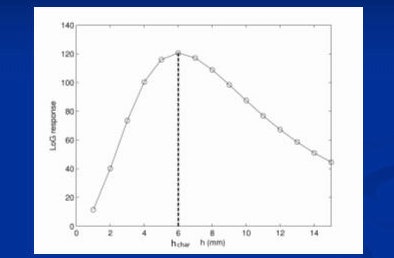
| Image analysis in the Laplacian space-scale for nodule representation uses a linear space-scale representation (top) of bloblike patterns on CT images using Laplacian of Gaussian (LoG) kernels. Bloblike patterns usually correspond to local maxima of LoG-filtered images (below), and multiscale analysis is performed using the space-scale signature plot. This space-scale signature presents a peak for a certain scale called a characteristic scale (third from top). The coordinates of the local maxima on the characteristic scale correspond to the estimated nodule location (bottom). All images courtesy of Dr. Stefano Diciotti. |
 |
 |
 |
The representation of the relationship, i.e., a linear space-based representation, "can be obtained by filtering the image by the LoG bank of filters having different scale parameters, each denoted by a letter [x, y, z]," he said. The local maxima are then detected on the different images, Diciotti said.
In the formula defining these relationships in a three-dimensional space, L(x, y, z, h) represents the convolution of the image f(x, y, z) having scale parameter h belonging to a prefixed interval, the authors wrote in an abstract. "For each scale h, the local maxima of L(x, y, z, h) are detected and for each maxima a course-to-fine tracking process is applied into the scale space. For a given point, the plot of L(x, y, z, h) versus h provides the blob signature."
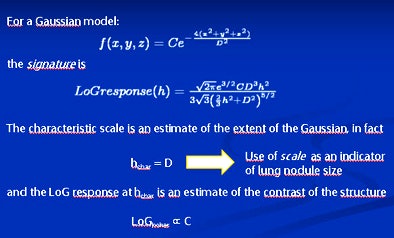
"The LoG response against the scale parameter space-based signature presents a peak for a certain scale called the characteristic scale," Diciotti said. "The coordinates of the local maxima and the characteristic scale are the estimated location of the nodule. For a Gaussian model of the lung nodule, the signature can be easily computed, and ... it can be proved that the characteristic scale is an estimate of the extent of the Gaussian and also that the LoG response of the characteristic scale is an estimate of the contrast of the structure. We make use of the characteristic scale as an indicator of lung nodule size."
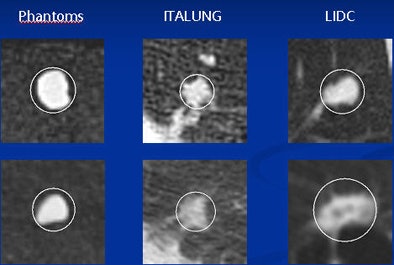
For the study, Diciotti and his team validated their method both in vivo and in vitro. The in vitro method employed a phantom containing 40 silicone synthetic nodules (approximately 115 HU) with irregular shapes in a background of marjoram (-865 HU). The phantom volumes ranged from 75.9 mm3 to 688.6 mm3, with an equivalent diameter ranging from 5.3 mm to 11 mm. The phantom was scanned using a four-detector-row CT scanner with a low-dose protocol and a large field-of-view, Diciotti said.
The in vivo validation utilized two datasets. The first set was a group of solid nodules that were stable over a two-year period from the three-year ITALUNG screening trial in Italy. The data included 44 small lung nodules in 38 subjects. A mean of 3.82 scans per nodule had been acquired for a total of 168 CT scans, once again using a low-dose protocol with a four-detector-row scanner.
The second dataset was from the Lung Imaging Database Consortium (LIDC) database in the U.S. and included 86 exams from various screening and diagnostic studies. For these data, the tube current ranged broadly from 4 mAs to 388 mAs, slice thicknesses ranged from 1.25 mm to 3 mm, and kV ranged from 120 to 140. The researchers found 58 small nonjuxtapleural nodules in the first reading session, Diciotti said.
The in vitro results demonstrated a close relationship between the characteristic scale and the true phantom volumes, Diciotti said. The Spearman rank coefficient between the true volumes and the scale was 0.99 in 40 phantom nodules (p < 0.001).
 |
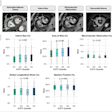
| Results showed good correlation between the characteristic scale and the true volume of phantom nodules: the Spearman rank correlation coefficient was 0.99 in 40 phantom nodules (p < 0.001). The in vivo studies also showed high Spearman rank correlation coefficients: 0.90 for the 164 ITALUNG cases (p < 0.001) and 0.82 for the 47 LIDC cases (p < 0.001). |
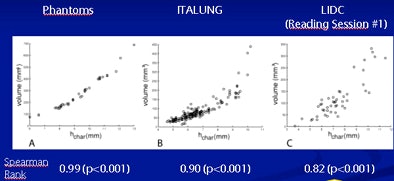 |
Both in vivo studies produced high Spearman rank correlation coefficients: 0.90 for the ITALUNG data (in 164 exams, p < 0.001) and 0.82 for the LIDC data (in 47 nodules, p < 0.001).
There were three failed measurements in the ITALUNG data and nine among the LIDC database nodules. "The reduced correlation and increased failure rates for LIDC are due to both the heterogeneity of the lesion [scanning] protocol and the presence of part-solid and ground-glass opacities" in the LIDC database, Diciotti explained.
The researchers also found "repeatability," -- i.e., the maximum difference between two measurements at random -- to be 1.1 mm on a Bland-Altman plot. This means that the difference between two measurements should exceed 1.1 mm in only 5% of measurements of stable nodules. Therefore, "if the difference between two successive scale measurements is greater than this value, that is evidence that the nodule scale has changed and that the nodule has grown" at least within a 5% error range, Diciotti said.
"The LoG characteristic scale of lung nodules is a consistent indicator of nodule size in CT imaging," he concluded. "A low failure rate for solid nodules was also observed. We believe the characteristic scale could be very usefully employed in [computer-aided detection (CAD)] systems for nodule detection, segmentation, and characterization." The detection of juxtapleural nodules needs further investigation, he said.
By Eric Barnes
AuntMinnie.com staff writer
November 25, 2008
Related Reading
CT databases aimed at lung imaging research, August 8, 2008
Ground-glass nodule features on CT reveal malignancy risk, April 29, 2008
CAD shines in detecting large nonsolid pulmonary nodules, February 27, 2008
Measuring lung nodule growth beyond variability, November 5, 2007
Radiologists no match for nodule measurement software, August 31, 2007
Copyright © 2008 AuntMinnie.com
