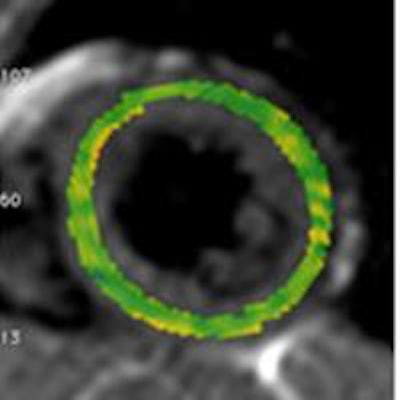
Mapping T2 relaxation times in MRI is an important first step toward better diagnosis of myocardial edema. But T2 relaxation times vary widely, both being functions of MR sequences and scanner field strength, so basic studies will be required to access their value, according to a recent presentation by German researchers.
"There is one big problem with T2 mapping in the myocardium," said Dr. Bettina Baessler from the University of Cologne Hospital in a presentation at RSNA 2014. "One has to use absolute values to make a reliable cutoff, and unfortunately there's a great range of T2 values in the literature."
 Dr. Bettina Baessler from University Hospital of Cologne.
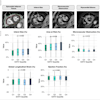
Aiming to establish norms and standards for MRI T2 mapping of the myocardium, the study sought to compare various sequences on a phantom and in healthy volunteers. The results showed significantly lower T2 relaxation times between the T2-prep sequence and two other sequences at 3-tesla scanning -- differences on the order of 10 msec depending on the sequence used, a level that represents nearly the full range of natural variability, Baessler said.
The wide variability "gives some hints that different sequence designs and different field strengths may introduce variations in the obtained T2 values," Baessler said. "Until now, there has been no direct systematic comparison of different sequences and field strengths, and that's why we did our study. We scanned a phantom ... at 1.5- and 3-tesla MRI, included 12 samples with a range of different T1 and T2 times."
Along with the phantom the study team enrolled 16 healthy volunteers for the same experiment. Each was examined on 1.5-tesla and 3-tesla clinical scanners, one after the other. In the evening, a third scan was performed on a 1.5-tesla scanner.
In each exam, three different T2-mapping sequences were performed at a basal, midventricular, and apical slice in the short-axis view: Sequences included:
- Multiecho spin echo (MESE)
- T2-prepared balanced steady-state free precession (T2-prep; Giri et al, 2009)
- Gradient spin echo (GraSe)
The researchers segmented T2 maps generated for each slice according to the American Heart Association (AHA) 17-segment model.
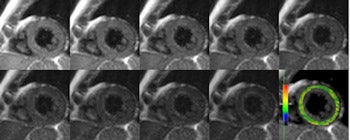
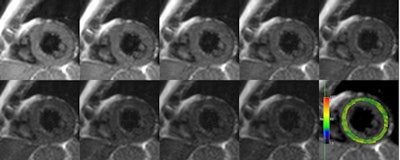
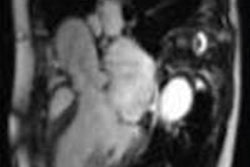
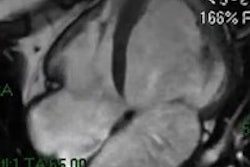
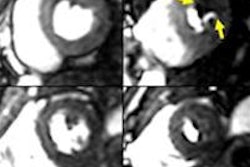
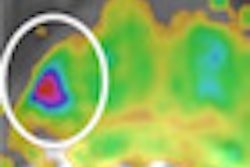
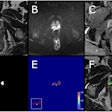
Raw MRI images with corresponding color T2 map in a healthy volunteer, acquired with a Gradient Spin Echo (GraSE) technique using nine gradient-recalled echoes.
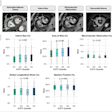
The results showed significantly lower T2 relaxation times between the T2-prep sequence and all other sequences at 3-tesla (p < 0.001) as well as at 1.5-tesla (p < 0.05 for T2-prep versus MESE, and p < 0.001 for T2-prep versus GraSe).
Significant differences were found for both T2-prep and GraSe (p < 0.001) when comparing relaxation times between 1.5-tesla and 3-tesla (p < 0.001). There were no apparent differences between morning and evening scans.
"We found significant differences between all tested sequences," Baessler said. "T2-prep generally showed the lowest (mean 53 msec) and graSe the highest (mean 60 msec) T2 values," revealing an average difference between the two sequences of 6 msec, she said -- quite high considering the relatively small range of values normally seen in the myocardium of between 10-20 msec, according to previous studies.
The differences at 1.5-tesla and 3-tesla are quite similar, but a little more pronounced at 3-tesla, she said. Generally T2-prep relaxation times were lower both in humans and in the phantom, but interestingly no extremely low T2-prep values were seen in the phantom study.
"We're still thinking about these results," and more studies will be needed, Baessler said. "For the meantime, it is crucial to obtain dedicated reference values for each scanner and field strength as we establish references values."
We're going to have a closer look to the underlying physics of the study, and this will perhaps lead to further improvements in sequence design and better interpretation of sequence parameters," Baessler continued.
For diagnostic decision-making in a clinical setting, it appears to be mandatory to define the appropriate cutoff values separately for each sequence and field strength, she said.
"Keeping all these points in mind, I'm confident that T2 mapping is a very interesting technique for routine clinical use," she said.


