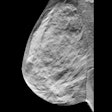
A Belgian study has found that remedying the influence of different imaging devices on breast density evaluations is crucial for mitigating biases in breast density-based risk stratification.
"Device-related factors, including acquisition and system parameters, are known to impact the resulting image quality," noted first author Tobias Wagner, a PhD researcher at KU Leuven, and colleagues. "Ensuring a vendor-neutral breast density estimate is crucial to prevent an inherent bias in assigning high-risk status during screening, which would affect the number of women invited for an adapted screening regime."
In an article posted by European Radiology on 31 January, the researchers proposed a simple method to reduce bias in breast density selection made using images obtained on equipment from three different vendors. They computed the densities corresponding to particular percentiles from the breast density distributions, and these were found independently for each vendor.
A total of 2,154, 540, and 255 exams were analyzed from Siemens Mammomat Inspiration (Siemens Healthineers), GE Senographe Essential (GE HealthCare), and Hologic Selenia Dimensions (Hologic) mammography devices. These images were from women who were eligible for the Flemish breast cancer screening program and were available in the DICOM "FOR PROCESSING" format.
The study used successive screening examinations collected during 2017 at three screening centers in the region of Flanders, Belgium. Diagnostic mammograms as well as exams with missing breast density values, which occasionally occur for very small breasts, were excluded.
The group estimated volumetric breast density and BI-RADS density class using TruDensity by Volpara Health. For data from GE and Hologic, two software versions (1.5.2.1 and 1.5.4) were used, depending on the timing of data collection and analysis. For the Siemens data, both versions were applied with a mean absolute difference in volumetric breast density between both software versions on a dataset of 2114 cases, using the most recent software version (1.5.4). Volpara Density Grade (VDG) is divided into four categories, from 1 to 4, and designed to correlate with the BI-RADS fifth edition classes of A, B, C, and D.
After application of the exclusion criteria to the full dataset, 2,083, 531, and 244 exams were evaluated for Siemens, GE, and Hologic respectively.
 Breast density distributions for the different vendors. The Volpara Density Grade (VDG) class distribution can be seen on the left, while the volumetric breast density distribution is depicted on the right. All figures courtesy of Tobias Wagner, Prof. Hilde Bosmans, PhD, et al and European Radiology.
The VDG class and volumetric breast density distributions for the different vendors can be seen in the figure above.
"It is apparent that there is some discrepancy between the proportion of very dense cases," the authors wrote. "For GE and Hologic devices, this is 9% and 9.4%, respectively, while that for Siemens is 13.4%. The volumetric breast density distribution for all three vendors reveals a heavily right-tailed distribution of the values, leading to a lower number of samples in the high-density area."
The frequency histogram of volumetric breast density of each VDG class for all vendors is shown in the figure below. Along with the volumetric breast densities, the 95% interval bar depicts the density range that contains 95% of all the data. Despite the masking effect contribution to the categorization process within the VDG class system, these 95% interval bars separate the four different VDG classes with little overlap, they stated.
 Normalized volumetric breast density distribution for each Volpara Density Grade class for the different vendors. The values are normalized for each VDG class. The horizontal bars depict the range of volumetric densities that 95% of values fall into for each class.
Supplemental testing proved that these results are independent of the sample size differences, Wagner and colleagues explained. To avoid potential bias due to the imaging device when selecting high-risk women, percentile-dependent density thresholds can be used to partition a population into different risk groups, they added.
A fundamental assumption of this work is that the underlying populations being assessed are the same. The data came from three different sites that are within 50 km of each other, all of which are located outside large urban centers. Around 11% of people in Flanders in 2023 have a foreign nationality, and six out of ten foreigners originate in one of the 27 countries of the EU, the authors noted.
Also, they conceded that it would be useful to include additional vendors in the analysis. Increasing the number of women, especially in the high-density range, would reduce the range of the 95% confidence interval of density thresholds, they pointed out.
You can read the full paper here. The co-authors were Lesley Cockmartin, Yao-Kuan Wang, Nicholas Marshall, and Hilde Bosmans.


