MRI can play a central role in the differential diagnosis of benign and malignant renal tumoral masses, French researchers have reported.
Investigators from Strasbourg University Hospital have explored the potential improvement of the assessment of renal masses on MRI by using the T1 and T2 mapping relaxation times (T1m and T2m). Their findings were published in the European Journal of Radiology on 15 September.
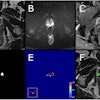
 Examples of native T1 and T2 mapping in the reference group and renal mass cohorts with region of interest (ROI) delineation. A: Native T1 mapping (left) and T2 mapping (right) coronal raw images of normal kidneys. Three oval ROIs measuring 0.30cm2 were manually drawn at the same symmetrical location of the left and right kidneys, including the superior, middle, and inferior pole of the cortex. B: Native T1 mapping (left) and T2 mapping (right) coronal image of an oncocytoma of the upper pole of the right kidney (maximum diameter: 3 cm). A freehand circular ROI in the tissue part of the mass was set at 1.0cm2.Images courtesy of Dr. Remy Henry, Prof. Catherine Roy, et al, and European Journal of Radiology.
There is a need for a non-invasive imaging marker to get more precise quantitative information on the tissue," noted first author Dr. Remy Henry and colleagues. "Mapping is a non-invasive MRI technique enabling tissue characterization based on the measurement of the native longitudinal T1 (T1m) and transverse T2 (T2m) relaxation times in milliseconds without any contrast agent."
The group recorded the renal cortex values of 125 patients with normal kidneys (reference group) and 75 patients with renal masses on a clinical 3-tesla MRI unit (Ingenia CX, Philips) and a standard 32-channel torso phased-array coil using T1m and T2m sequences. For the quantitative evaluation, measurements were performed by delineating regions of interest (ROIs) on T1m and T2m sequences in the renal cortex of the reference group and in renal masses.
Patients were scanned with normal hydration status, no fluid intake restriction, and no fasting. These mapping sequences were implemented on the MRI scanner. The T1 and T2 mapping sequences were performed before gadolinium injection.
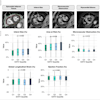
For the cohort of reference group, mean renal cortex T1m and T2m values were 1,529±83ms and 98±7ms, respectively. No statistically significant differences were found for T1m and T2m in the reference group regardless of age, gender, or (estimated glomerular filtration rate (eGRF) categories.
For the group with renal masses, mean T1m and T2m values were 1,667±87ms and 105±8ms; 1,621±96ms and 117±6ms; and 1,530±62ms and 85±4ms for renal cell carcinomas (RCC), angiomyolipomas, and oncocytomas, respectively. For T1m values, there was no significant difference among the three types of renal masses, the authors stated.
“However, we have found a statistically significant difference for the T2m value (p = 0.0005). Among histological subtypes, only T2m values were statistically significant for each combination: RCC versus angiomyolipoma (p = 0.012), RCC versus oncocytoma (p = 0.0002), and oncocytoma versus angiomyolipoma (p = 0.003),” they continued.
There are inevitable variations of mapping values caused by the increase of B0 from 1.5 to 3T, such as a rise in T1 accompanied by a decrease in T2, but the researchers still think that for such advanced sequences, a clinical high-field magnet at 3T offers a better option than a low-field magnet. As those sequences have a short acquisition time, there is no real additional time to get more information on the tissue, and as those sequences were implemented for routine clinical cardiac practice, it was easy to use them for another organ.
The key findings were more or less in line with expectations, senior author Prof. Catherine Roy told AuntMinnieEurope.com on 16 September. The results of the study have not yet led to any changes in how her team diagnoses these cases in Strasbourg. “We need to collect more data for benign processes,” she noted.
Despite the small sample size, these sequences can play a role in the differential diagnosis between benign and malignant renal tumoral masses, but this needs to be confirmed by further research. Follow-up studies are now being planned because there is a clear need to collect more data on kidney -- and perhaps prostatic -- carcinoma, Roy added.
You can read the full EJR paper here.