An international research team used dozens of CT images to map breast density in a 16 January study published in Medical Physics. Their technique could lead to more accurate radiation dose estimates and improved breast cancer risk models.
The team utilized a program to model how compression changes the distribution of fatty and fibroglandular tissue on digital breast tomosynthesis (DBT) and digital mammography. The breast models showed that fibroglandular breast tissue was distributed unevenly and, sometimes, not symmetrically during compression.
"The characteristics of breast CT allow, to date, for the highest glandular detail depiction, possibly leading to an improved breast tissue characterization," wrote the authors, jointly led by Christian Fedon, PhD, and doctoral student Marco Caballo from the department of medical imaging at Radboud University Medical Center in Nijmegen, the Netherlands.
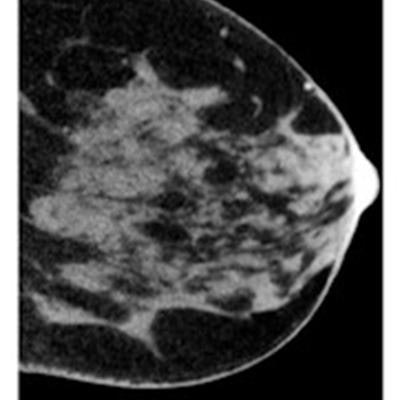
For their study, the authors used 88 isotropic 3D images acquired by a dedicated breast CT system prototype. Breast imaging technologists acquired both CT and DBT images as part of an unrelated clinical trial that included women ages 50 or older undergoing additional breast screening after receiving a BI-RADS 0, 4, or 5 mammogram result.
A program automatically classified voxels in the breast CT images as air, skin, fatty, or fibroglandular tissue. Computer software then converted the classified CT images into a biomechanical breast model.
The authors ran the breast model through a program to simulate breast compression during a mammogram and/or DBT exam. They divided the compressed model into 70 regions in order to analyze tissue distribution in axial, coronal, and sagittal directions.
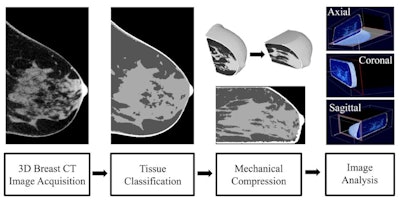 A flow chart demonstrating how the authors moved from capturing the initial breast CT images to analyzing fibroglandular tissue distribution of compressed breasts. Image published in Medical Physics on January 16.
Their model showed fibroglandular tissue tended to concentrate below the midplane of the breast. Fibroglandular tissue was also higher in regions closer to the nipple and sparser in regions near the skin and chest wall.
In addition, the distribution of fibroglandular tissue was not always symmetrical on compression. Distribution was symmetrical lateromedial direction on the craniocaudal (CC) view. But on the mediolateral (MLO) view, fibroglandular tissue was more often located in the anterior direction and had about a 12% shift from the center of the breast to the side.
Furthermore, the authors observed differences in density maps between the CT scans and the ones generated by the DBT system. The mammogram vendor's maps showed less variation throughout the breast in the sagittal direction than on the CT scan. This resulted in higher fibroglandular tissue in lateral and medial regions in the MLO view and lower fibroglandular tissue in the central area on both CC and MLO views.
The authors noted that researchers may be able to use this type of breast tissue model to improve radiation exposure and breast cancer risk modeling. In fact, in a prior, related study, the same team used the models described in this study to estimate that patients received approximately a 30% reduced dose on mammography compared with current models of homogenous breast density distribution.
"This understanding could be used to improve radiation dosimetry models and their corresponding risk," the authors wrote. "In addition, this study might provide further insight on how the location of dense breast tissue, and not only its amount, relates to breast cancer development risk."


